class: left, top, title-slide .title[ # <strong>Measurements of (im)-permeability</strong> ] .subtitle[ ## Elie Gurarie, Nicole Barbour + partners ] .author[ ### GIUM Inaugural Meeting - July, 2023 ] --- <style type="text/css"> .remark-slide-content { font-size: 24px; padding: .5em 2em 2em 2em; } </style> .pull-left-60[ ## The intro slide that no one here needs **Barriers** are important! - *habitat fragmentation*, *migration disruption*, *connectivity* **Artificial barriers** - Roads / Fencing / Rail / Power lines / Industrial Infrastructure **Natural barriers** - Rivers / Lakes / Topography / Snow quality ] .pull-right-40[ .center[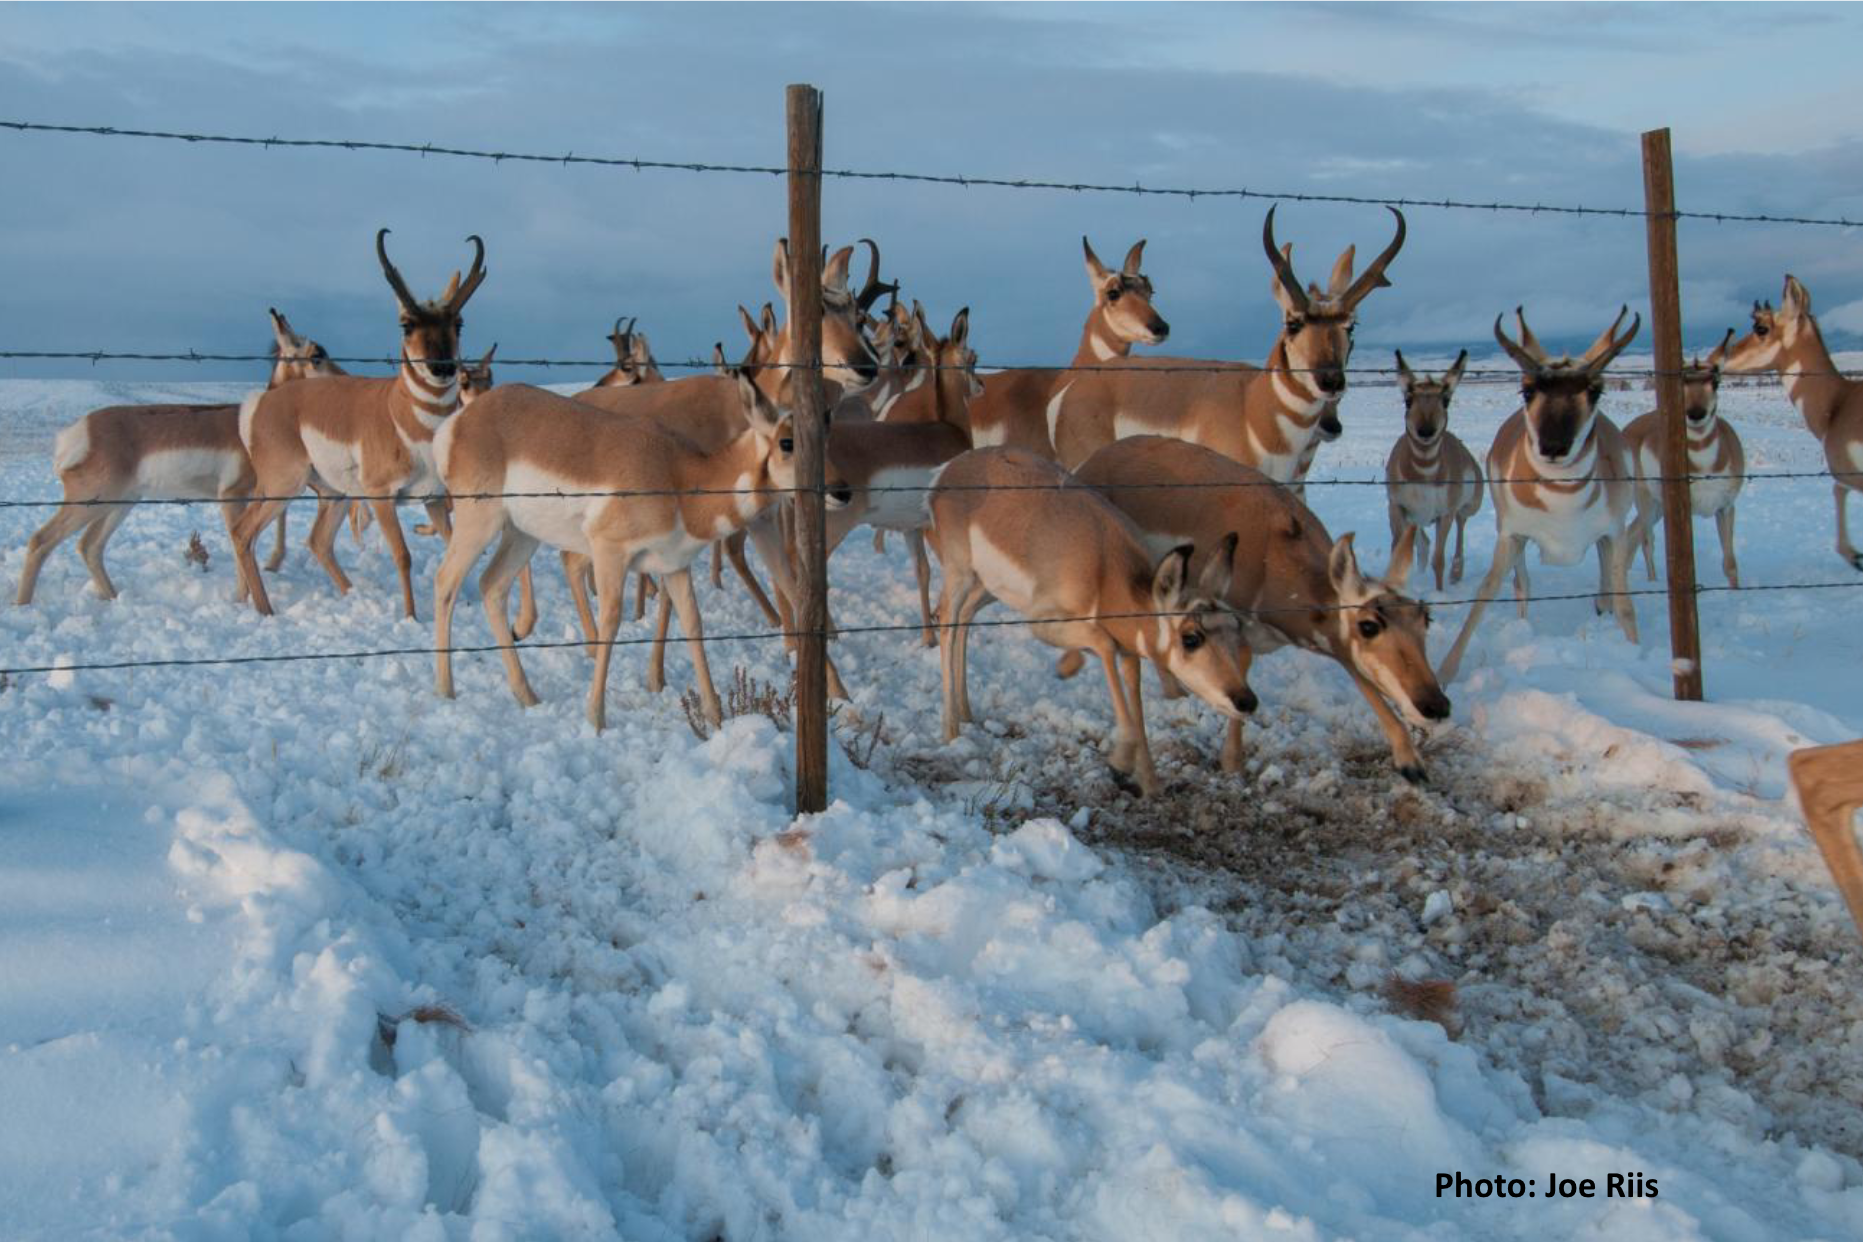] 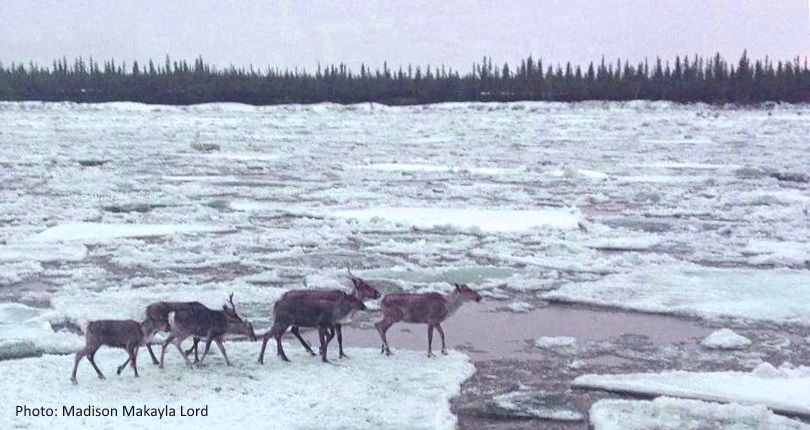 ] --- .pull-left[ ## Boreal caribou ... 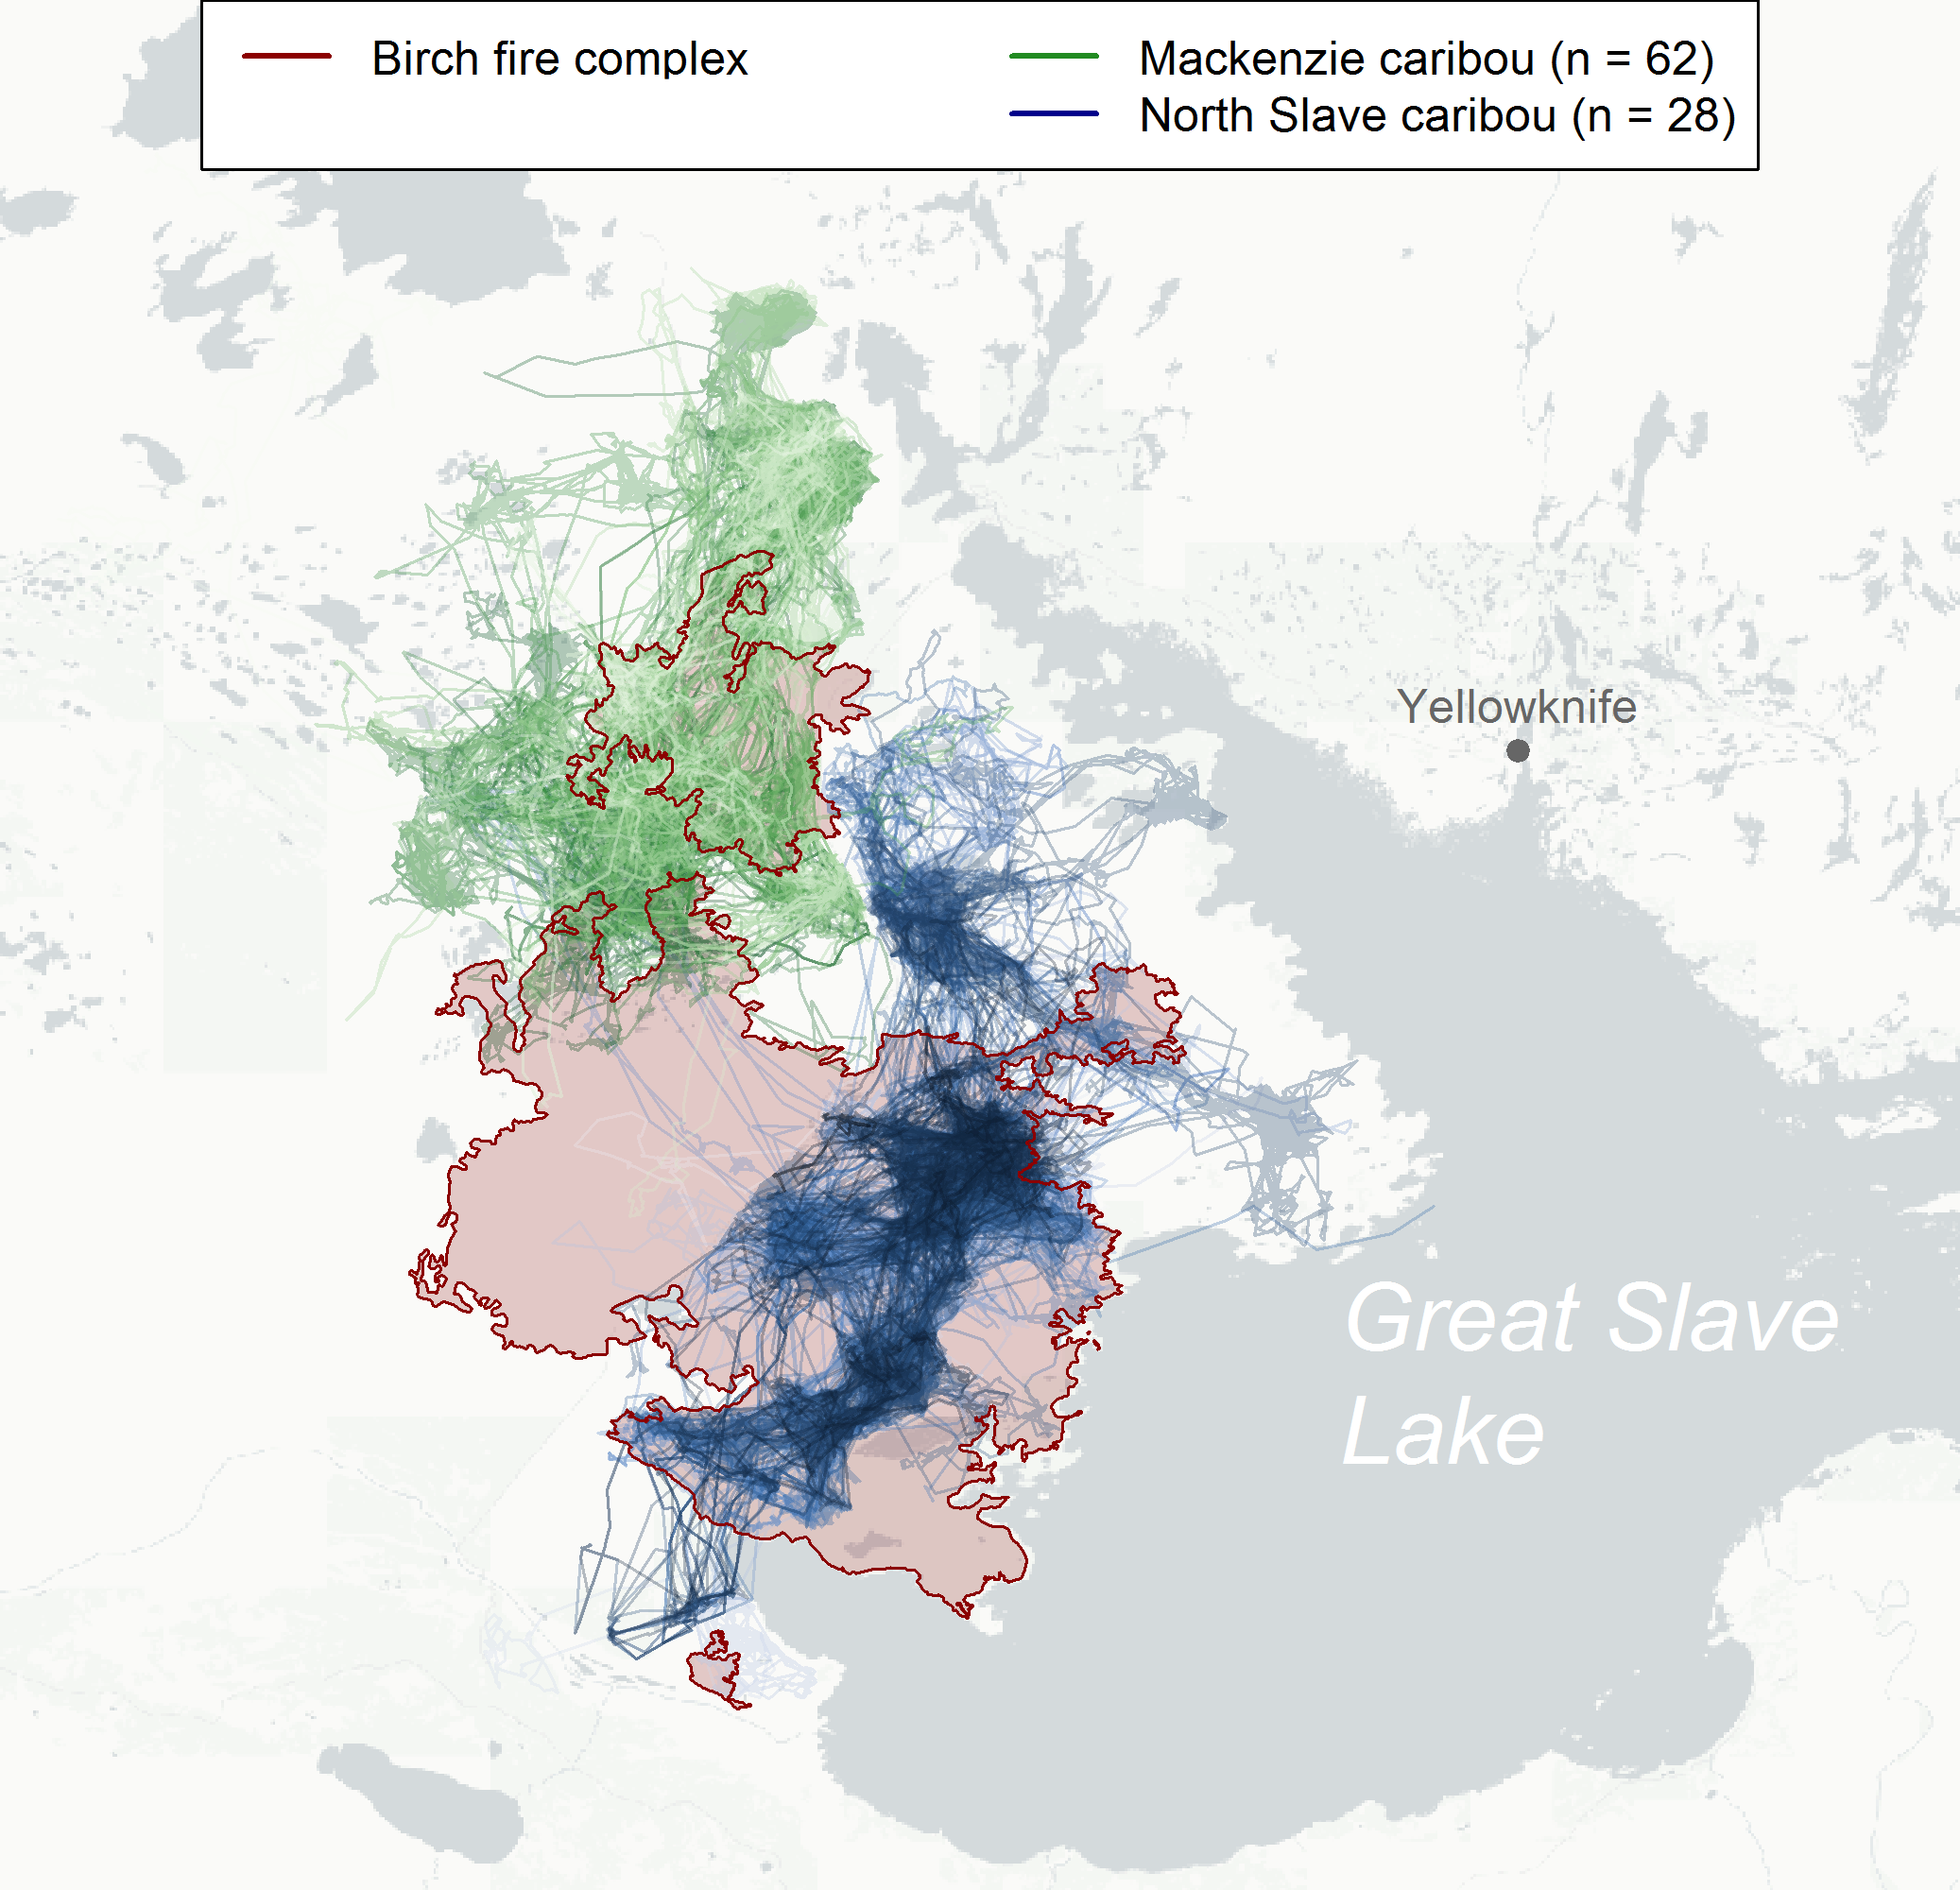 ] .pull-right[ .center[] ] --- .pull-left[ ## Boreal caribou ... with highways 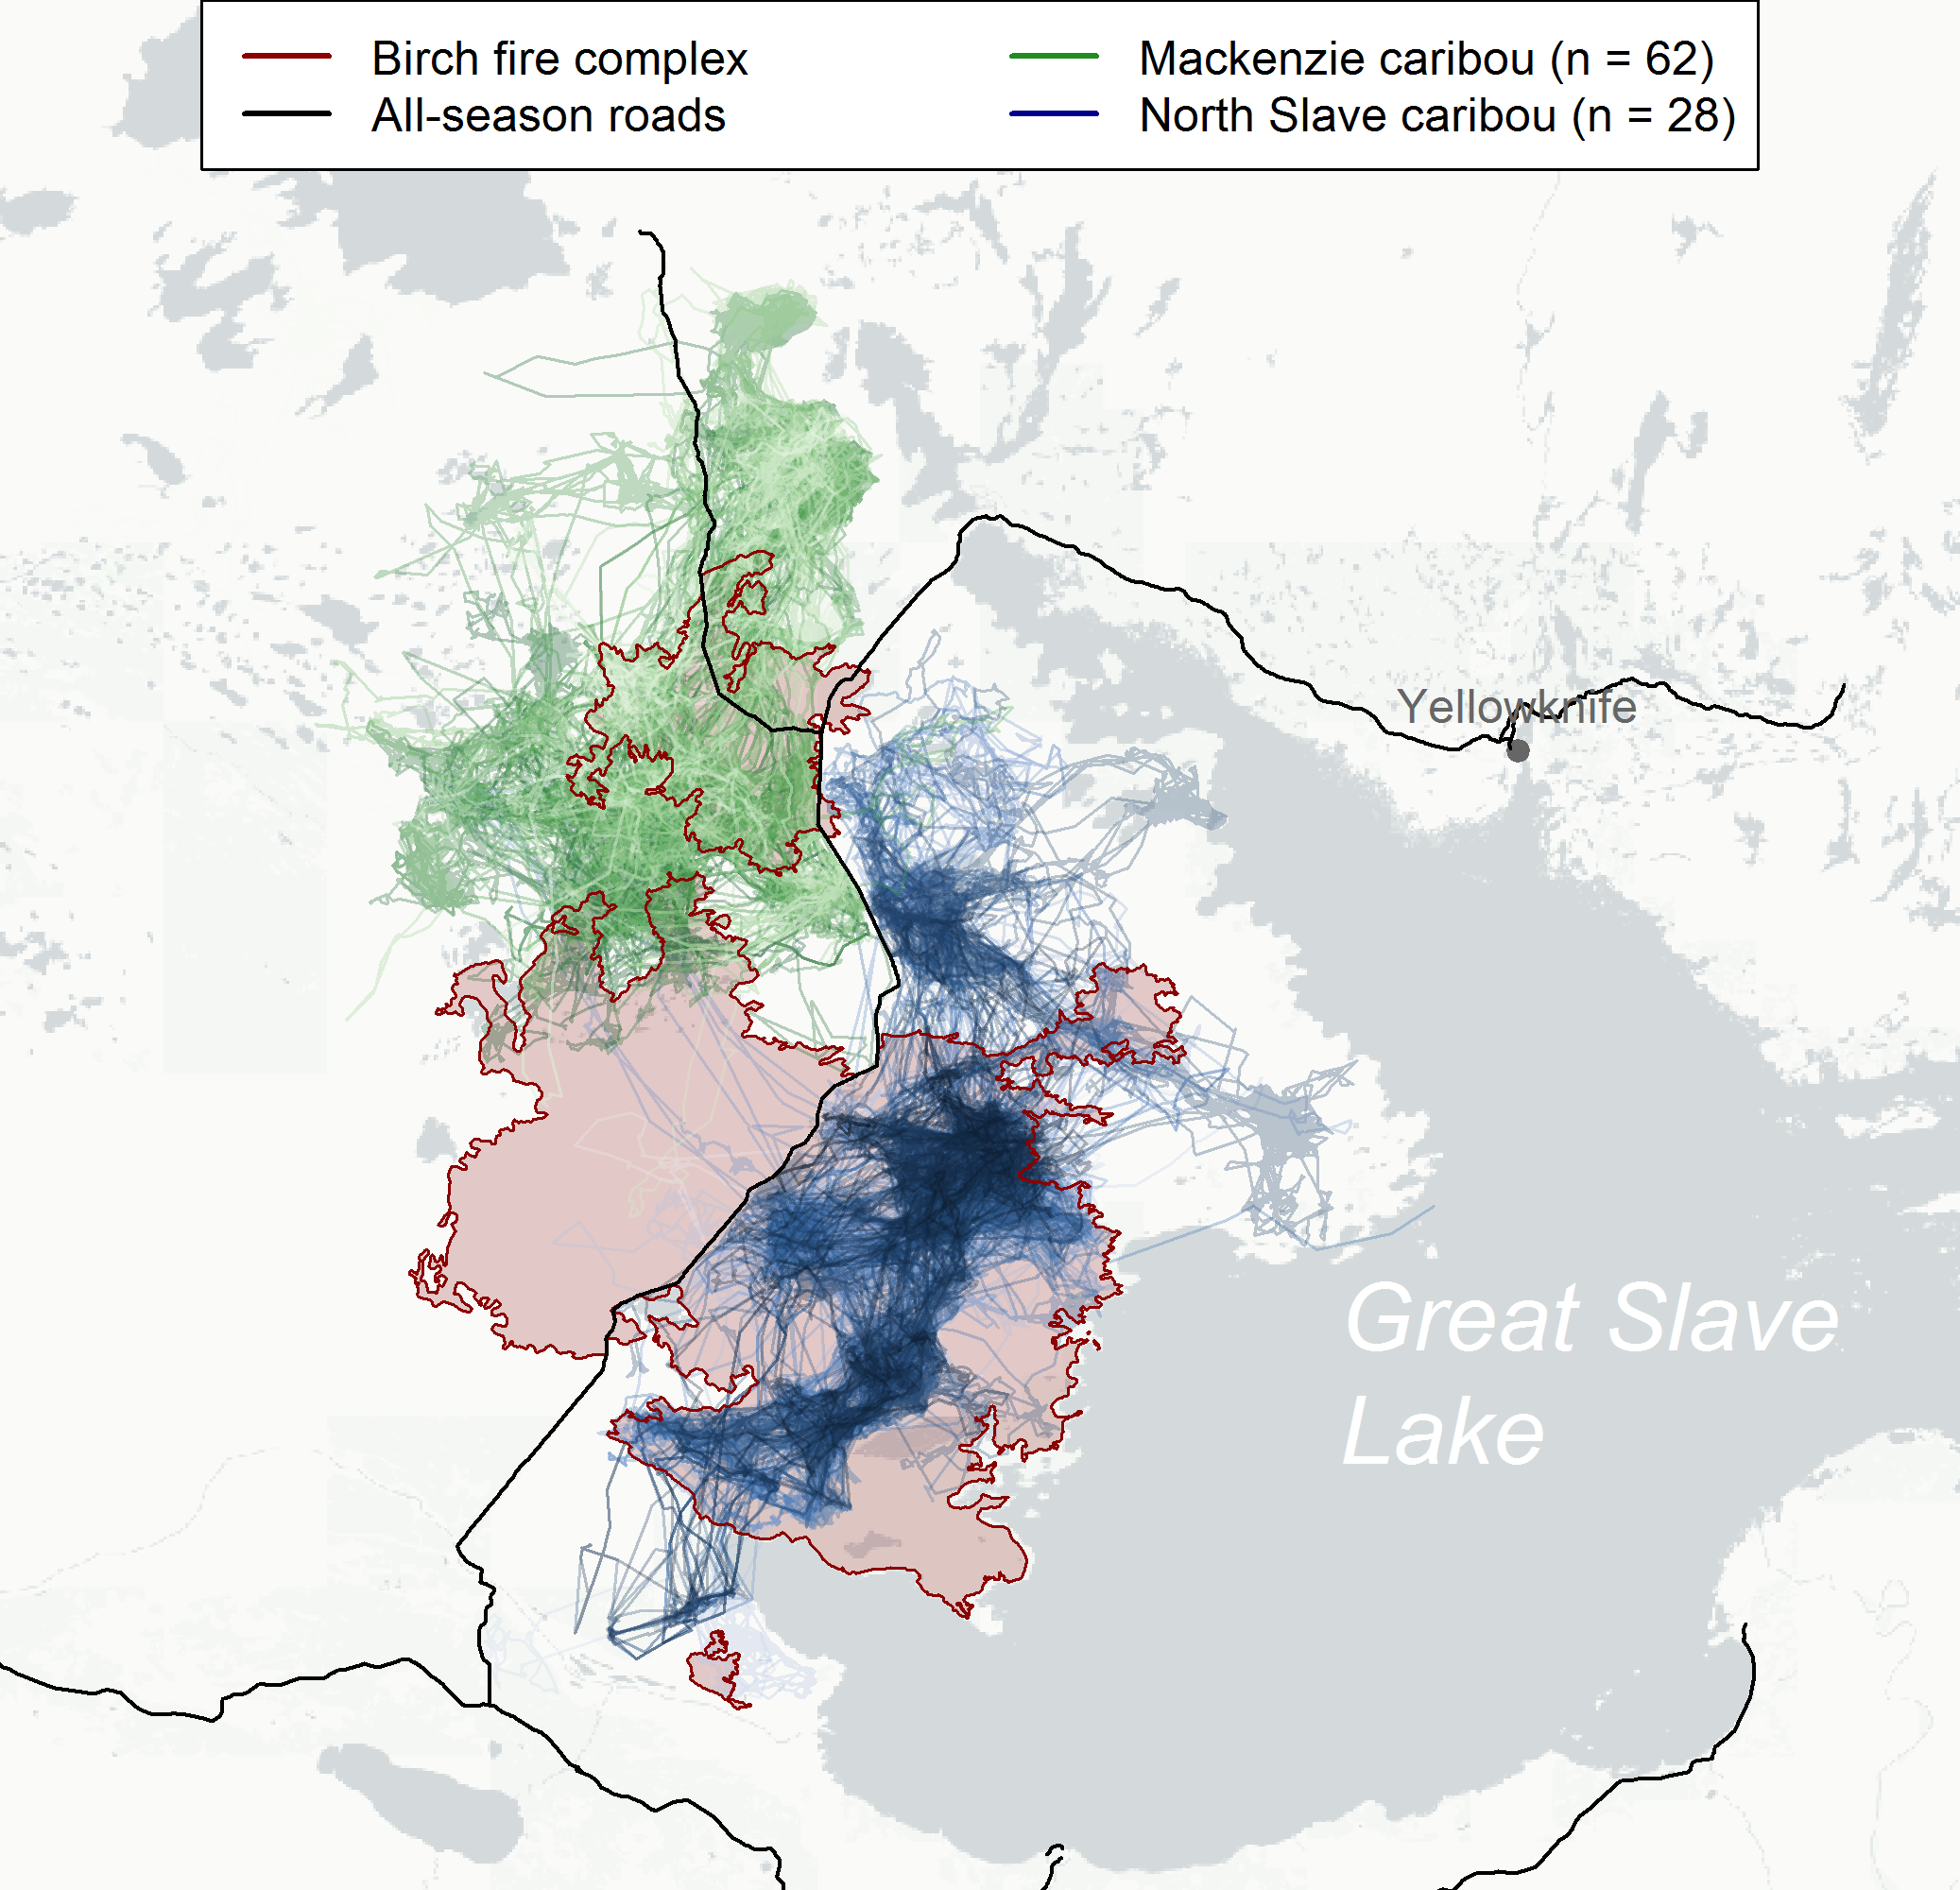 ] .pull-right[ .center[] 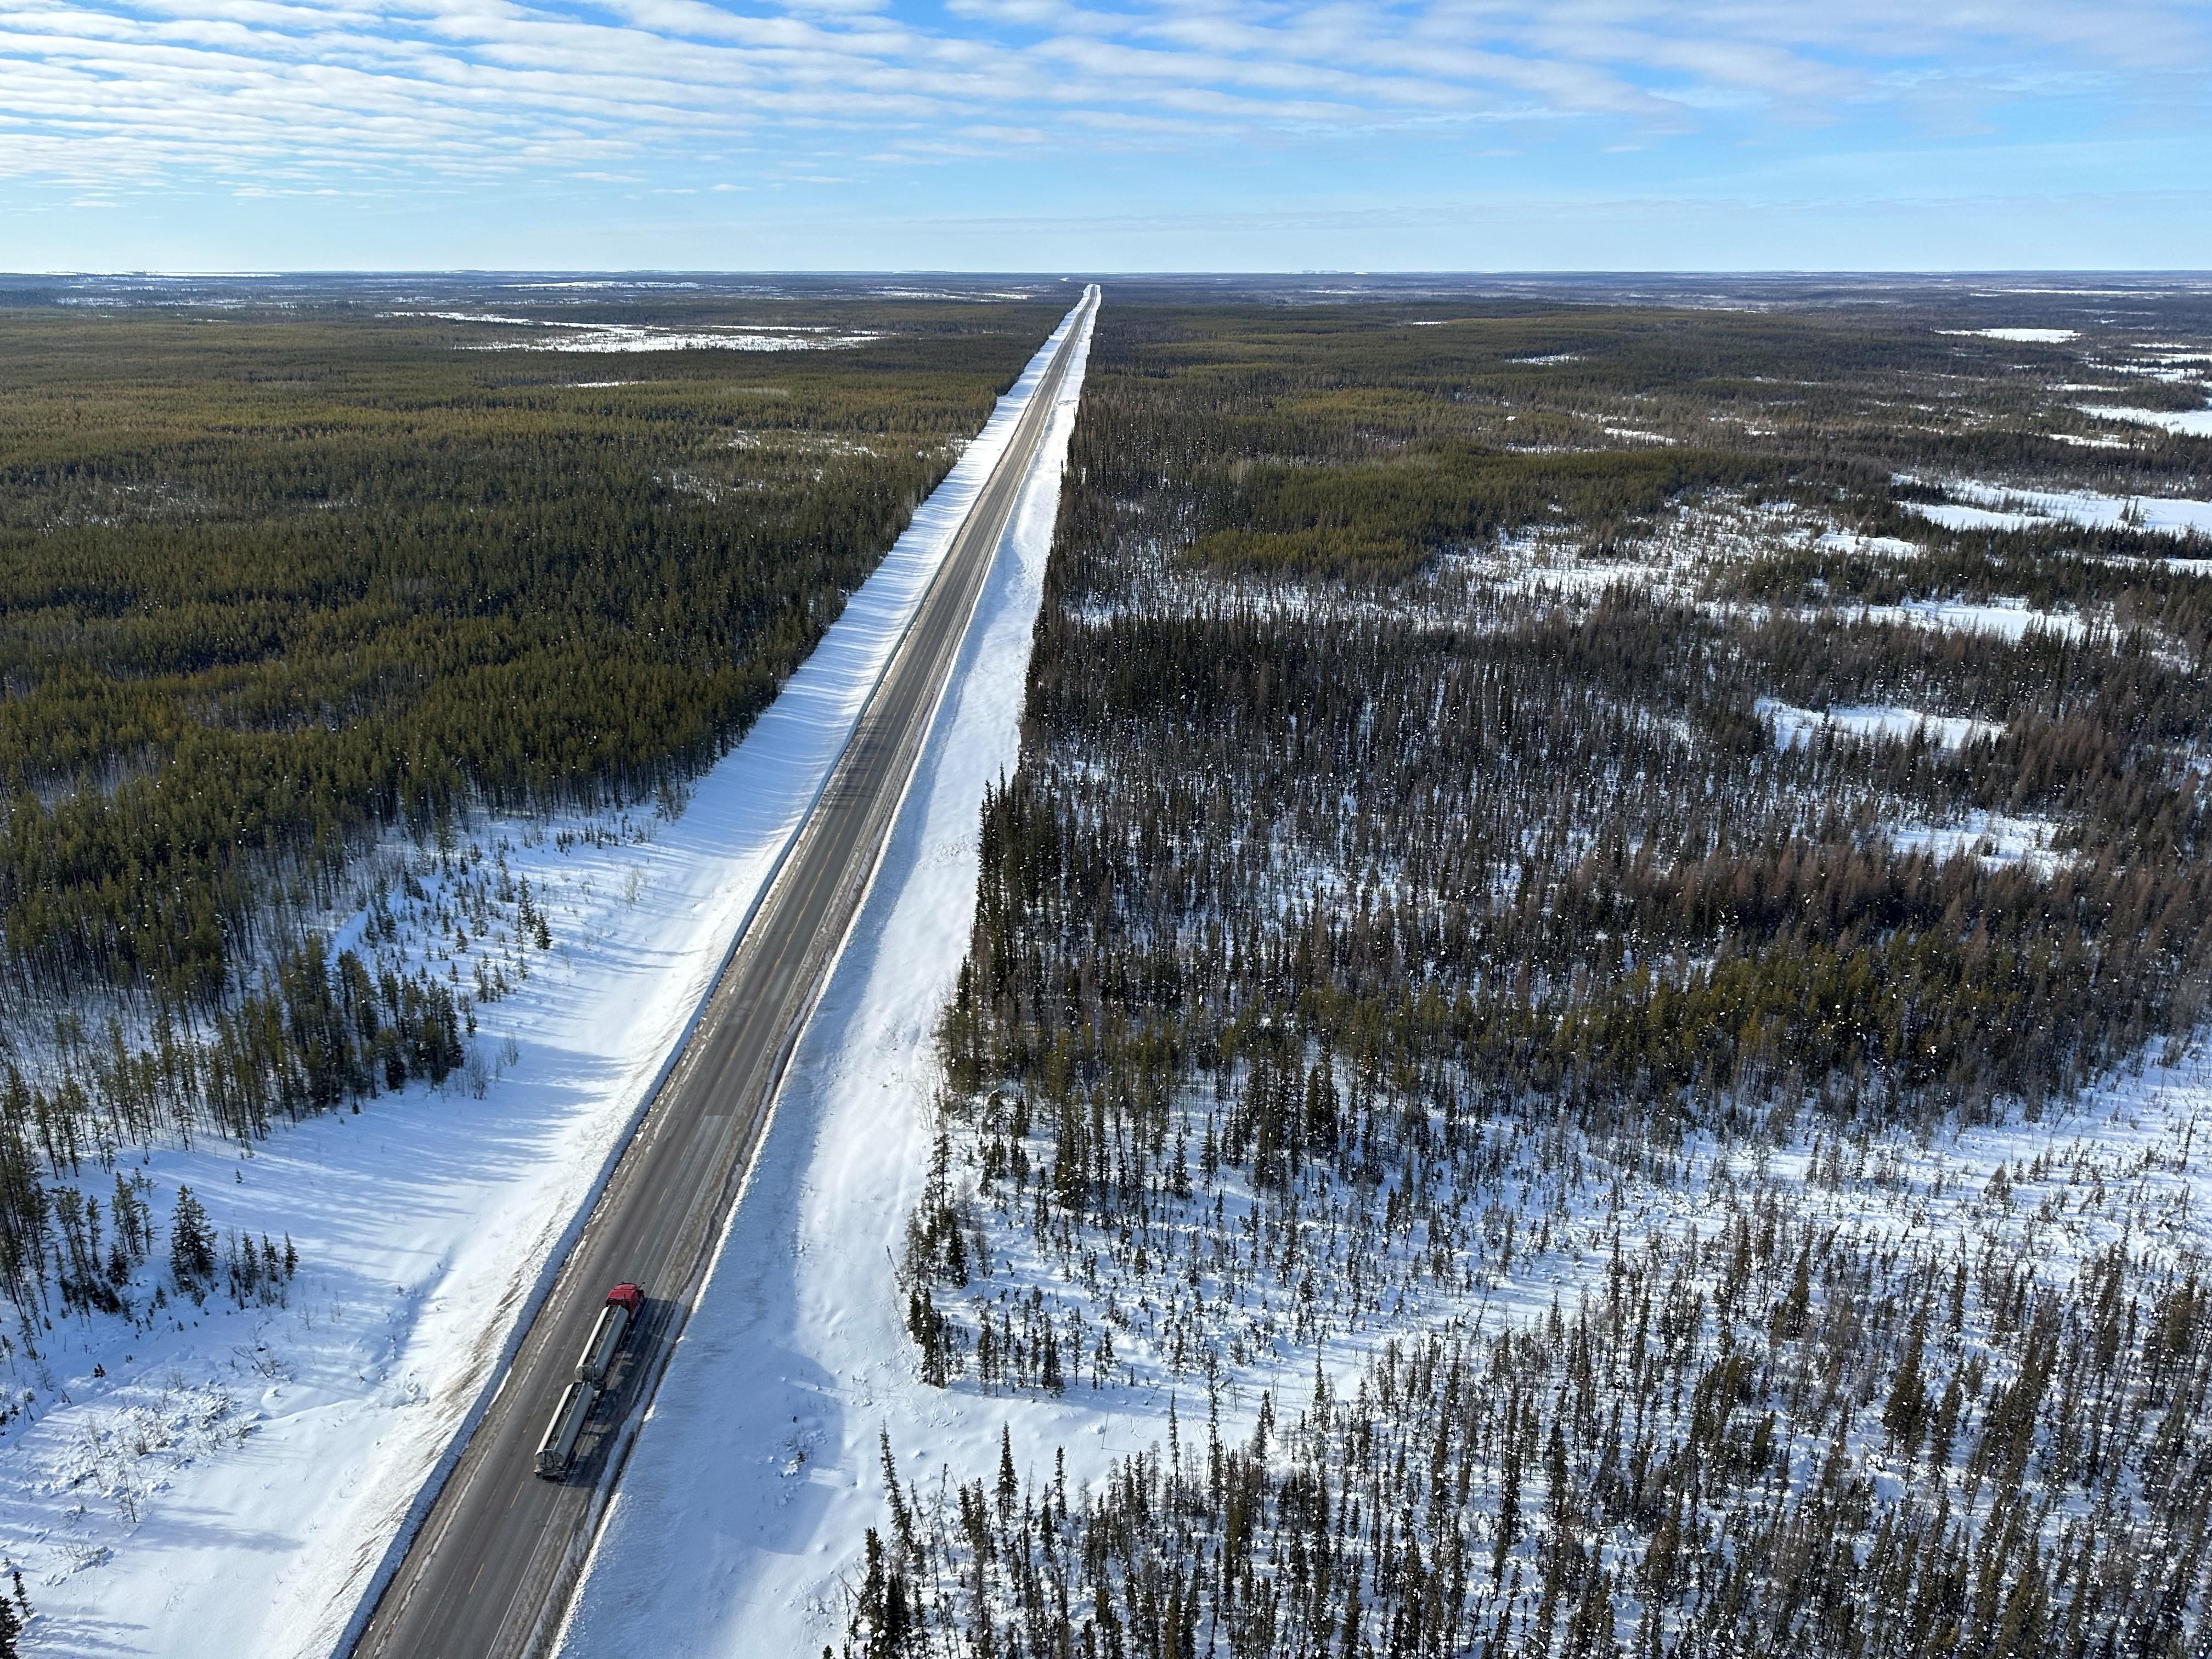 ] --- # Migratory caribou and industrial development .pull-left-70[ <br> <video width="800" controls align="center"> <source src="animations/ekatianimation_winter_zoom.mp4" type="video/mp4"> </video> ] .pull-right-30[ ### Diavik Diamond Mine 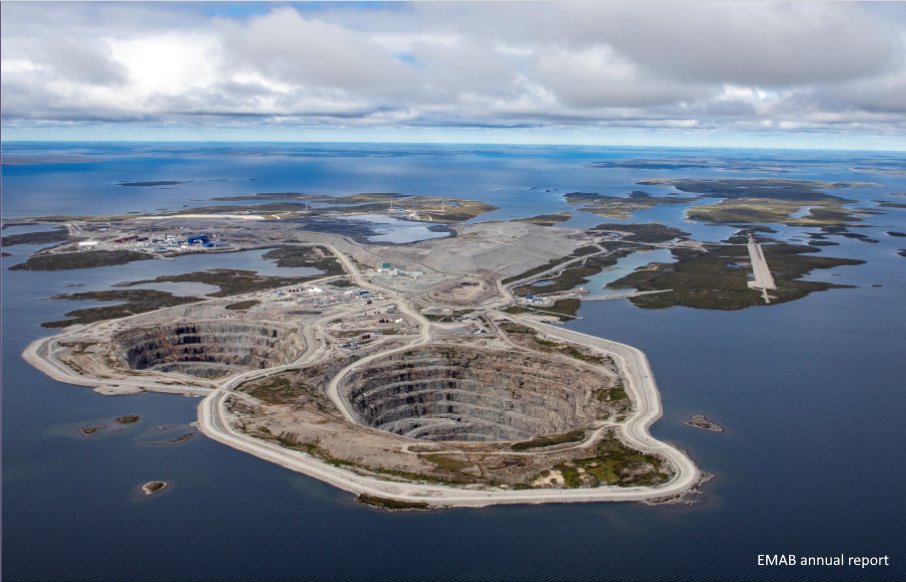 ### Bathurst herd caribou  ] --- .pull-left-40[ ## Zone of influence Segmented **Resource / Step Selection Function** against distance. .center[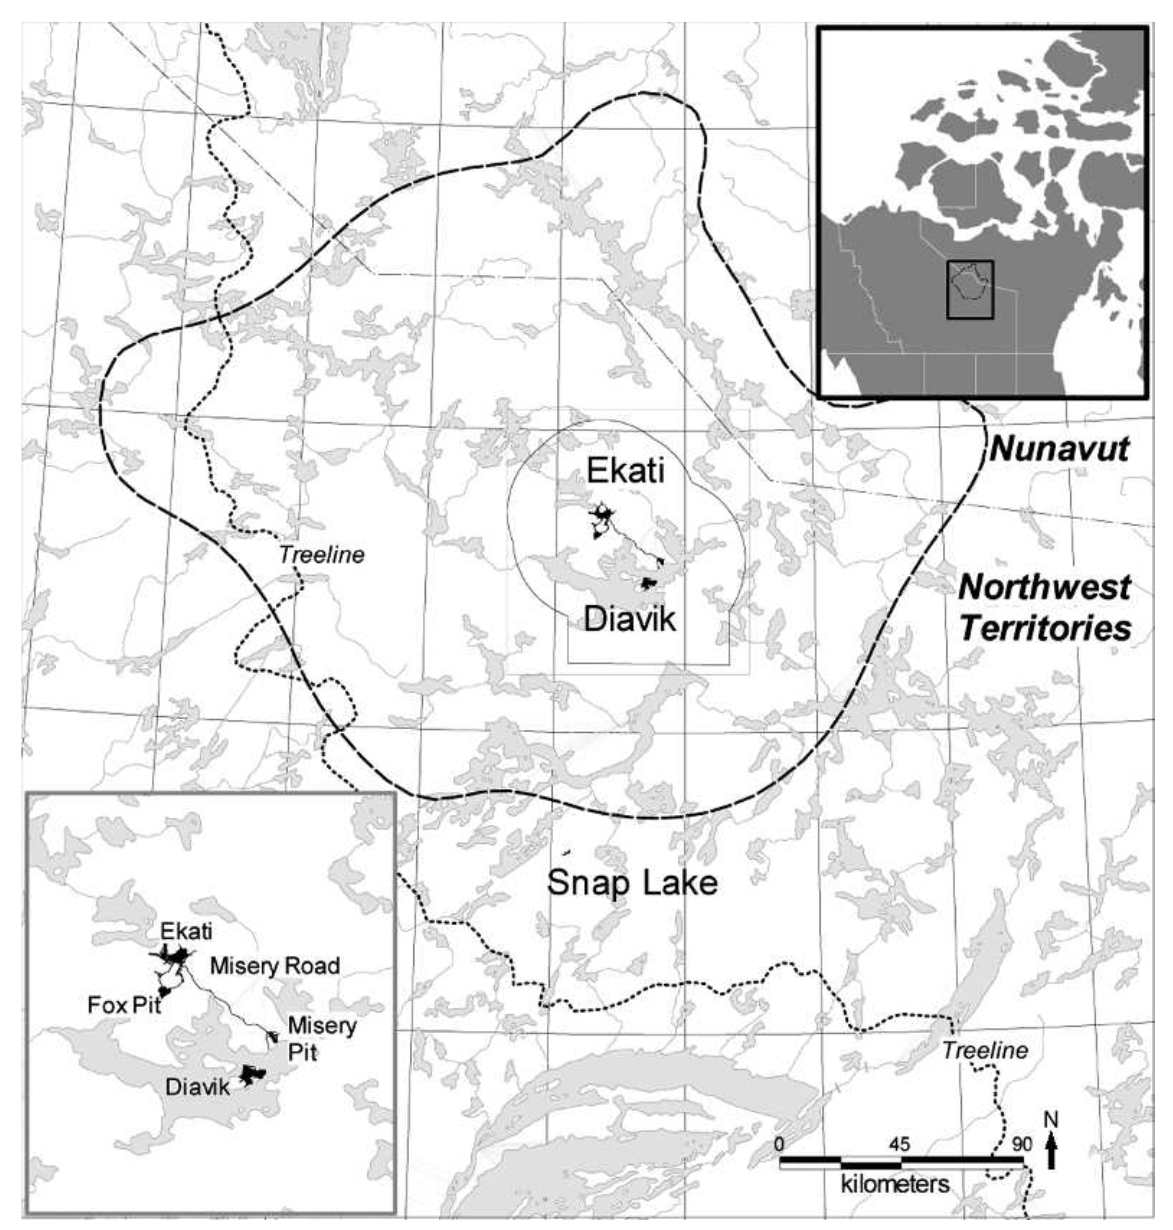] Ekati/Diavik mine complex in the middle of Bathurst caribou range: ] .pull-right-60[ Estimated ZOI: **7.1** to **16.8** km - but quite variable! .center[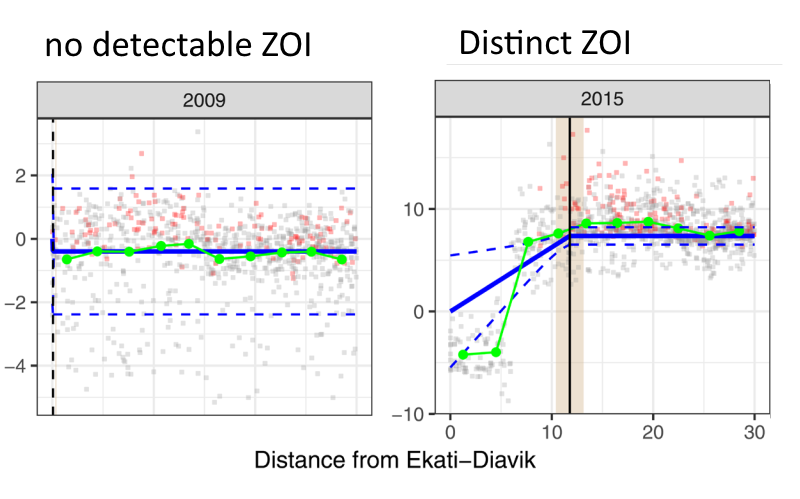]  ] --- .pull-left-30[ # Movement-centric analyses 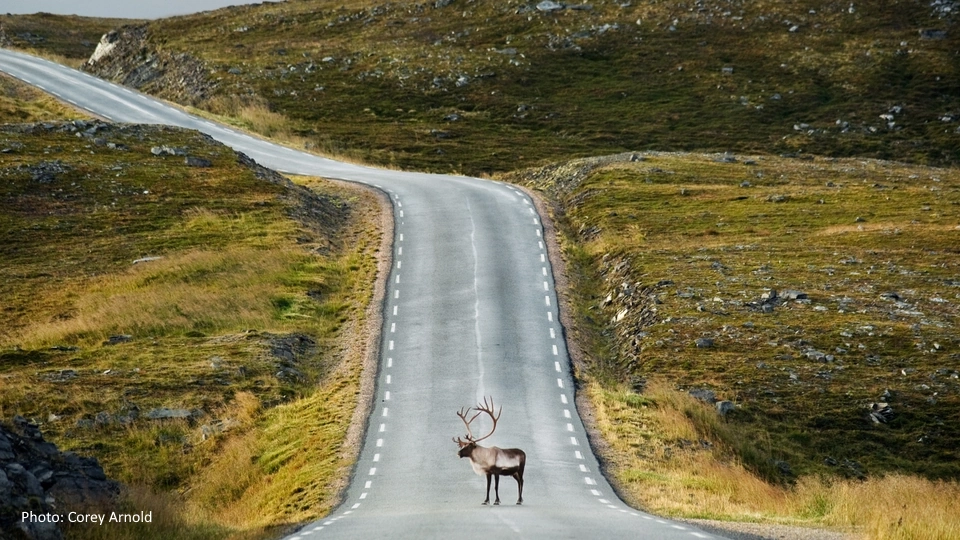 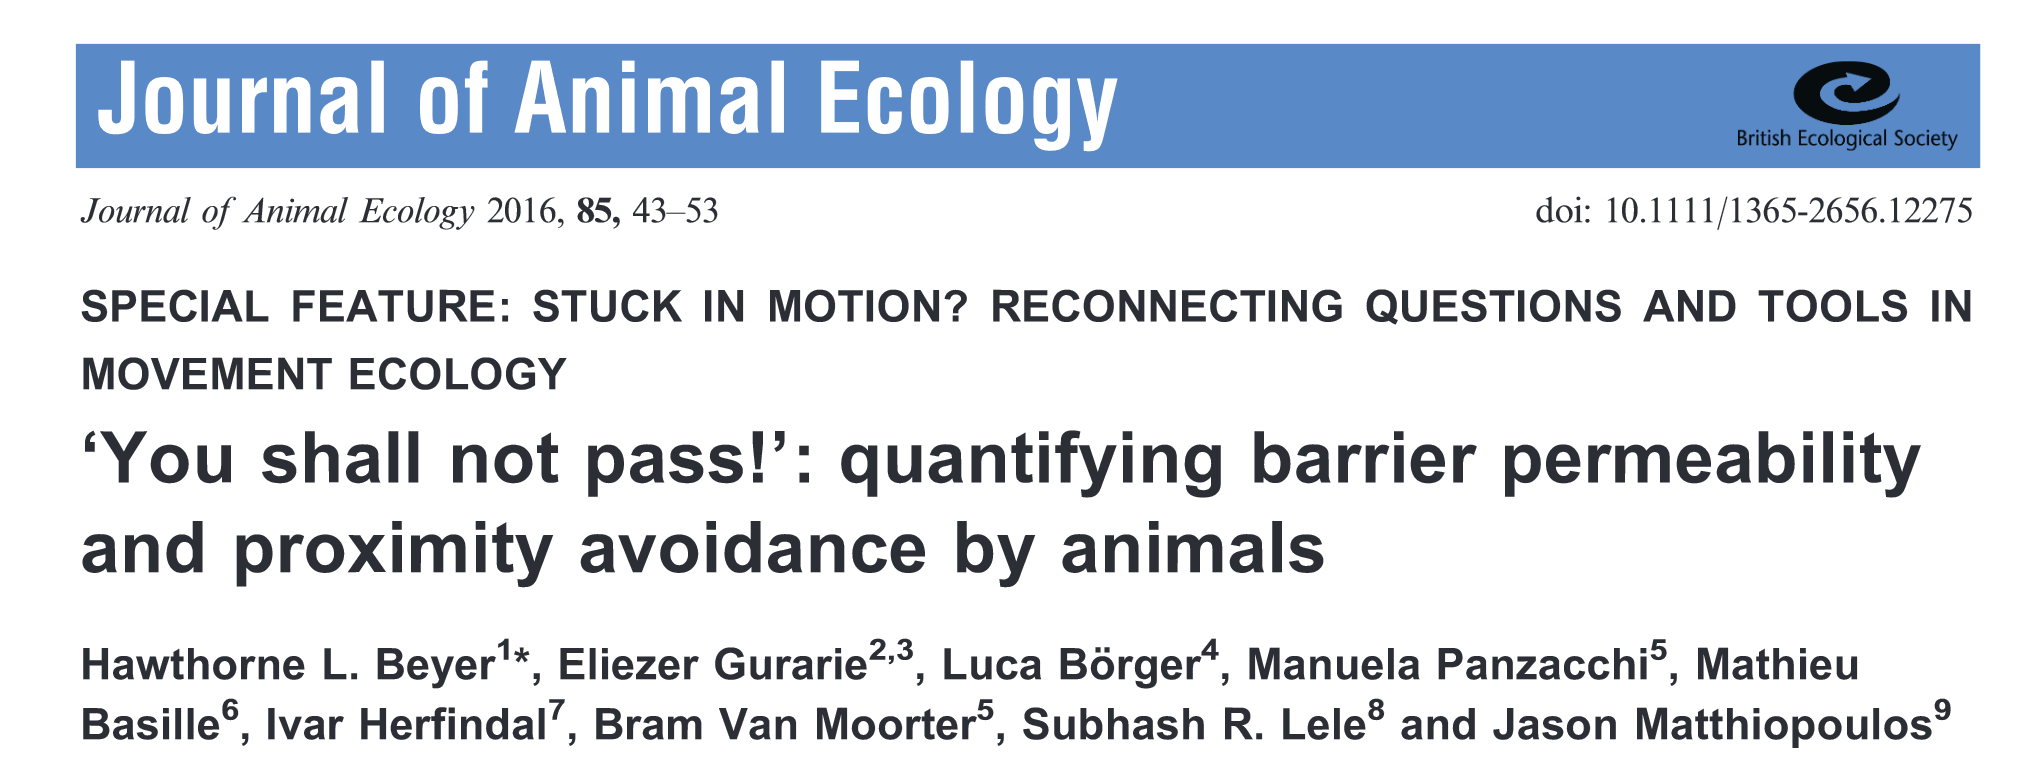 ] .pull-right-70[ Quantify the **permeability** of linear elements - applied to wild reindeer in Norway. 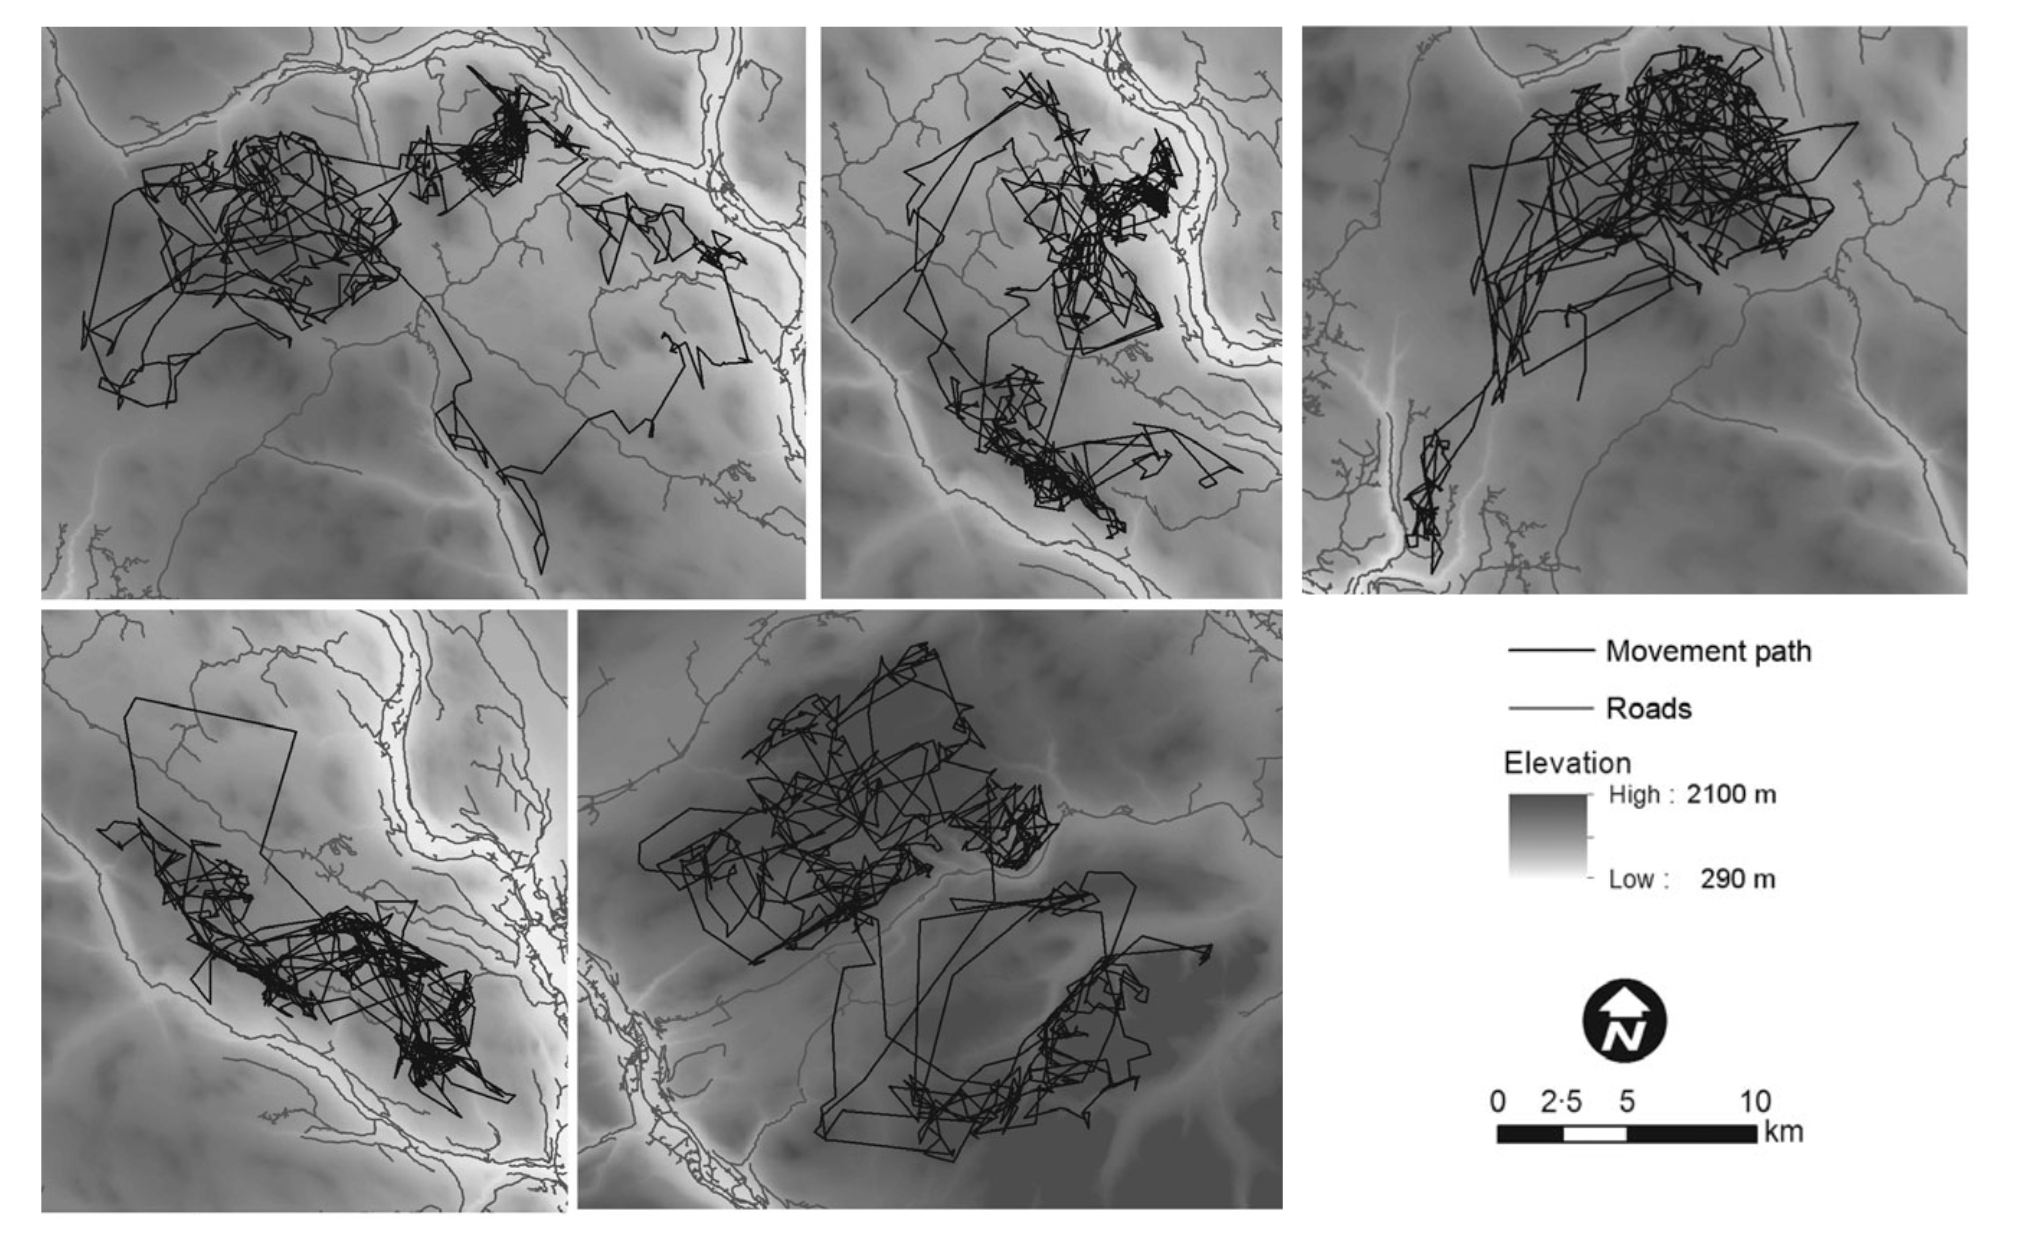 ] --- .pull-left-30[ # Movement-centric analyses   ] .pull-right-70[ Quantify the **permeability** of linear elements - applied to wild reindeer in Norway. 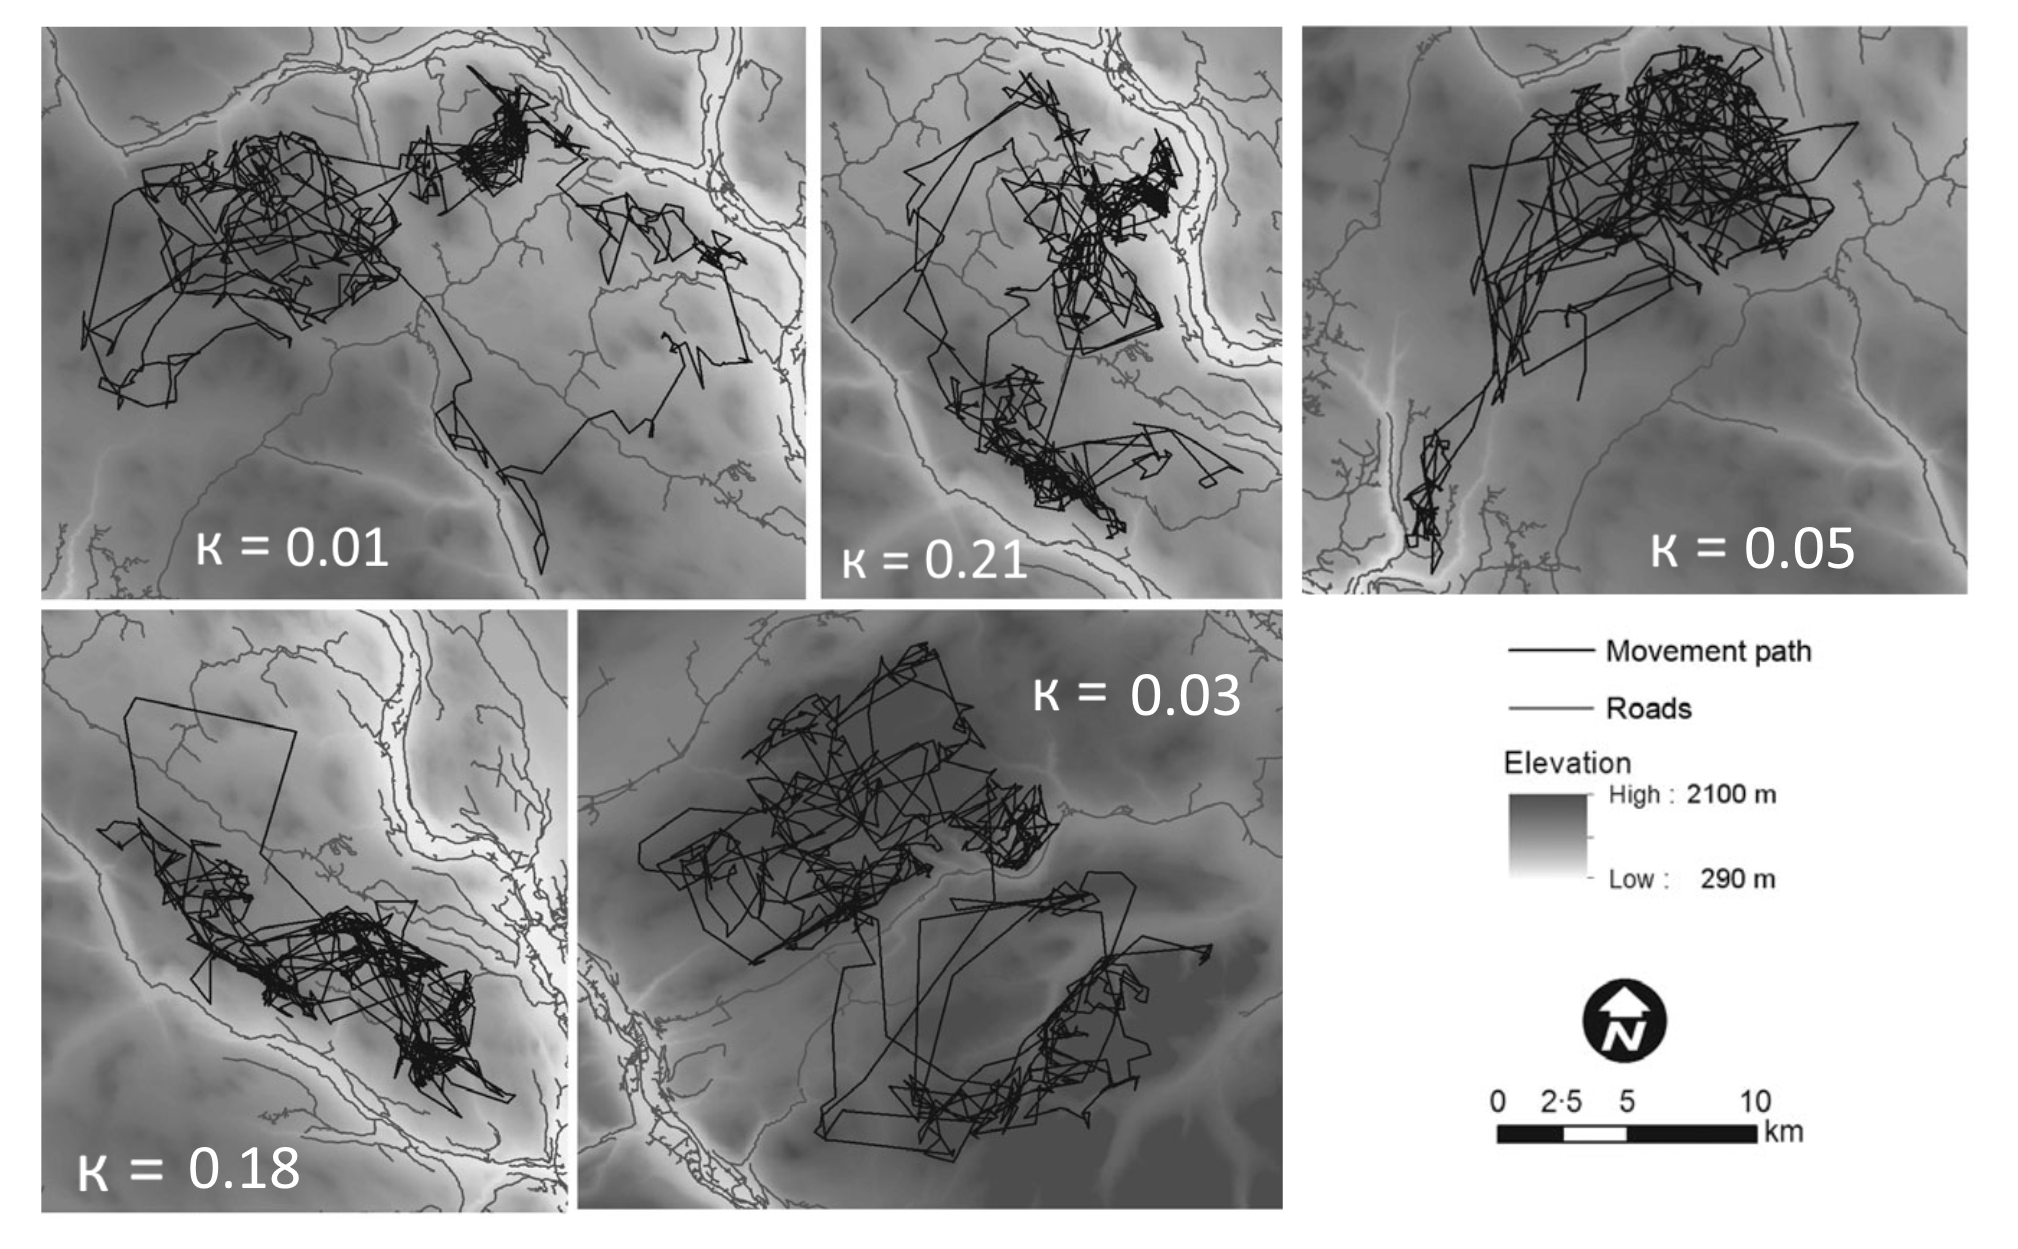 .darkblue[For these animals, road permeability ranges (approximately) from **0.01** to **0.21**] ] --- # A few issues: .pull-left-40[ - Hard to implement - Slow - Animal, not road, centric ] .pull-right-60[  ] -- .center.large.darkred[**Our goal is to make this analysis accessible and applicable!**] --- .pull-left-60.large[ # Permeability If the barrier is **perfectly permeable**, the probability of selecting a new location does not depend on whether it crossed. **The barrier might as well not be there** ] .pull-right-40[  ] --- .pull-left-60.large[ # Impermeable barrier An **impermeable barrier** has zero probability of crossing. ] .pull-right-40[  ] --- .pull-left-60.large[ # Semi-permeable barrier A location across a **semi-permeable barrier** has *some* probability of crossing. The **permeability index** is `\(\large \kappa\)`. `$$0 < \kappa < 1$$` ] .pull-right-40[  ] --- .pull-left-60.large[ # Hyper-permeable barrier If `\(\kappa > 1\)`, an organism in the vicinity of a barrier is **more likely** to cross it! ] .pull-right-40[ 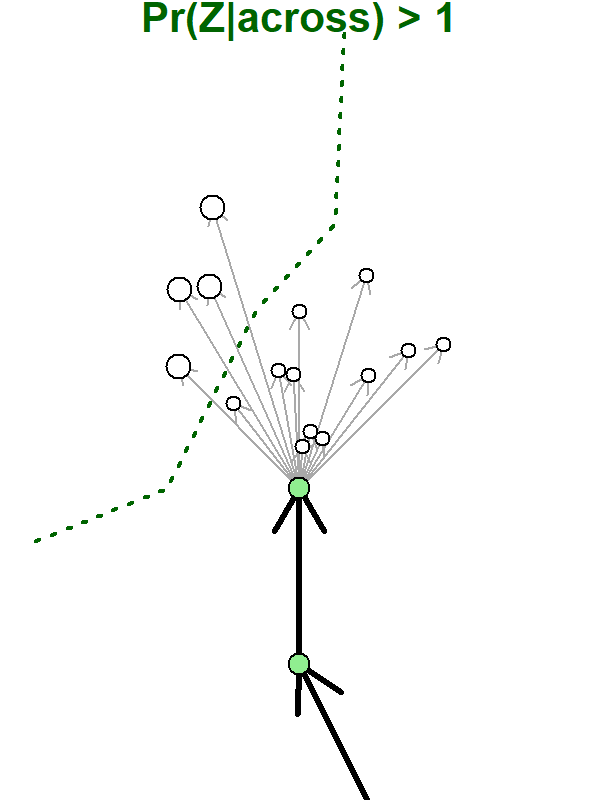 ] --- ## Animated intuition ![:col_header permeable, semipermeable, impermeable] ![:col_row <video controls> <source src="animations/permeable.mp4" type="video/mp4" </video>, <video controls> <source src="animations/semipermeable.mp4" type="video/mp4" </video>, <video controls> <source src="animations/impermeable.mp4" type="video/mp4" </video> ] --- # Barrier and resource preference .center[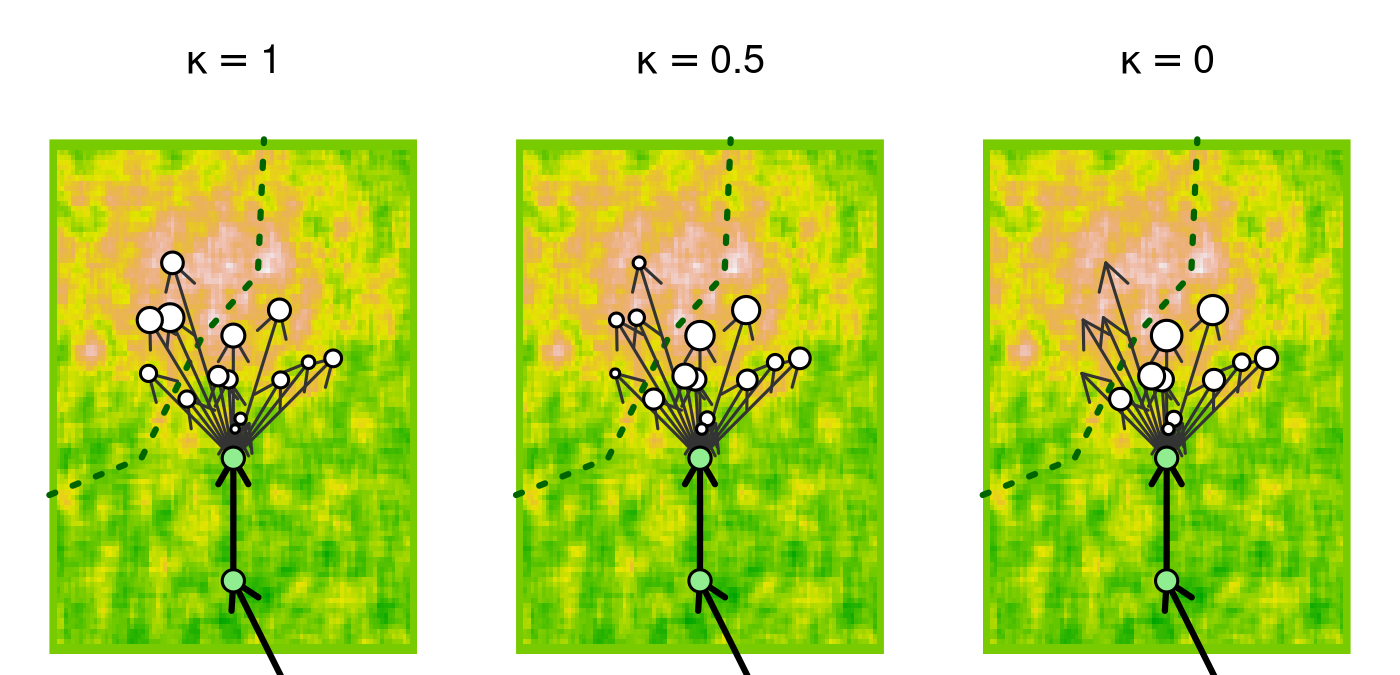] --- # Impermeability has consequences Biased walk towards center of attraction (e.g. calving ground) with barrier in the middle .center[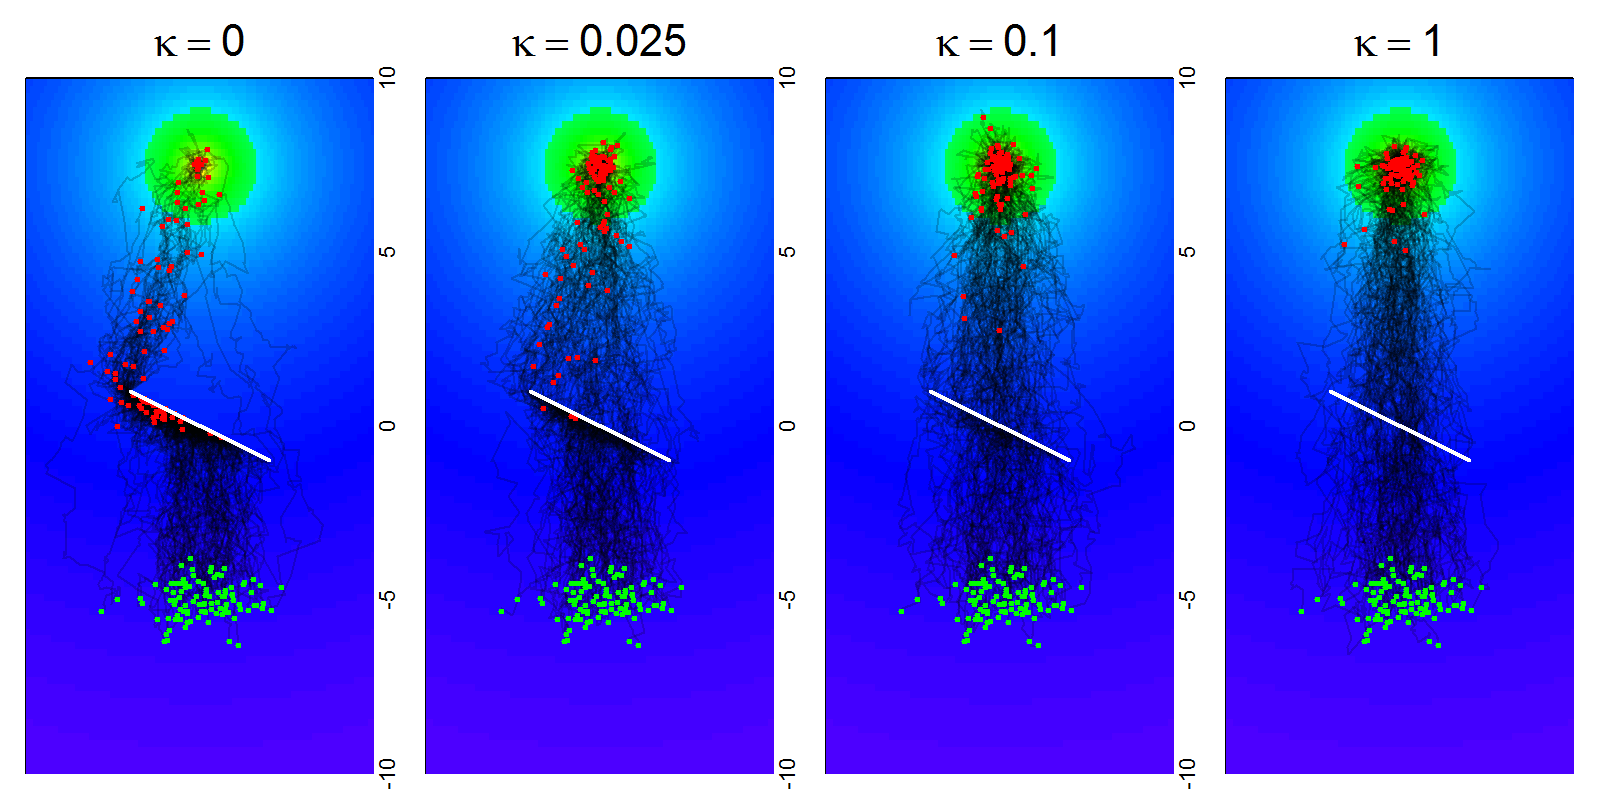] --- # Impermeability has consequences on **proportion** of animals arriving, and on **timing** of arrival. .center[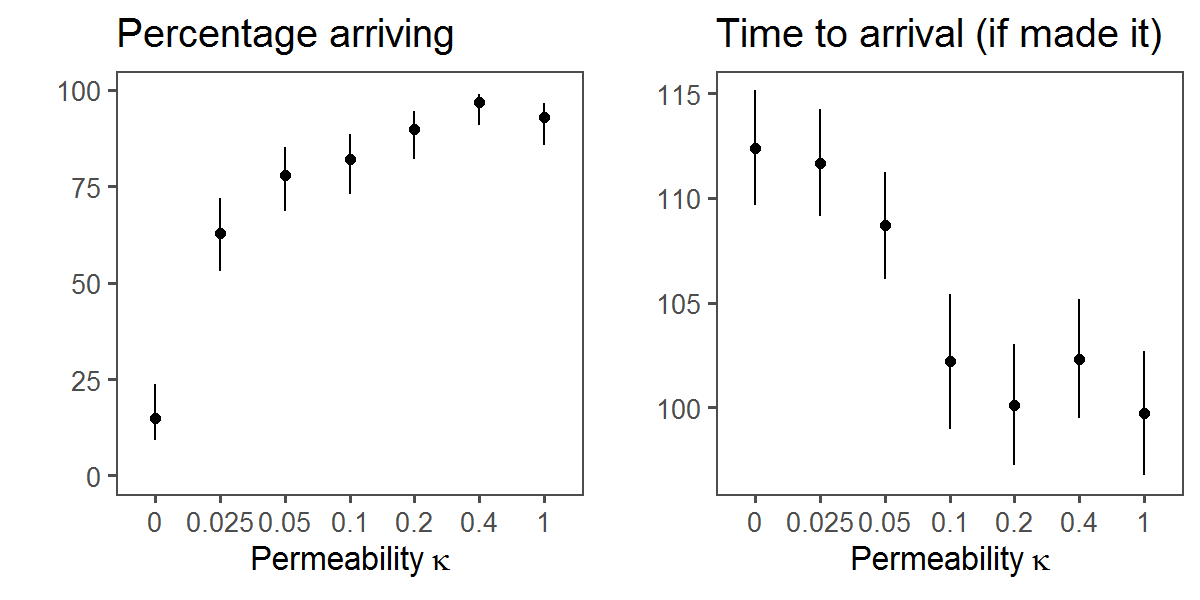] --- # But these effects are obscured revealed by ZOI analysis .pull-left-40[ ZOI determined by peak of log-likelihood curve ...  .tiny.center[(*Boulanger et al. 2012*)] ] -- .pull-right-60[ ... which does not appear at all with barriers.  .red[Absence of **Zone of Influence** does not equal absence of **Barrier Influence**!] ] --- # **Estimation** .pull-left-40[ 1. Regularize data 2. Find actual crossings 3. Compute possible steps 4. Assess whether each possible step crossed 5. Estimate `\(\kappa\)` using maximum likelihood ] .pull-right-60[ .pull-left-40[] .pull-right-60[] ] --- # Example with simulated data .pull-left[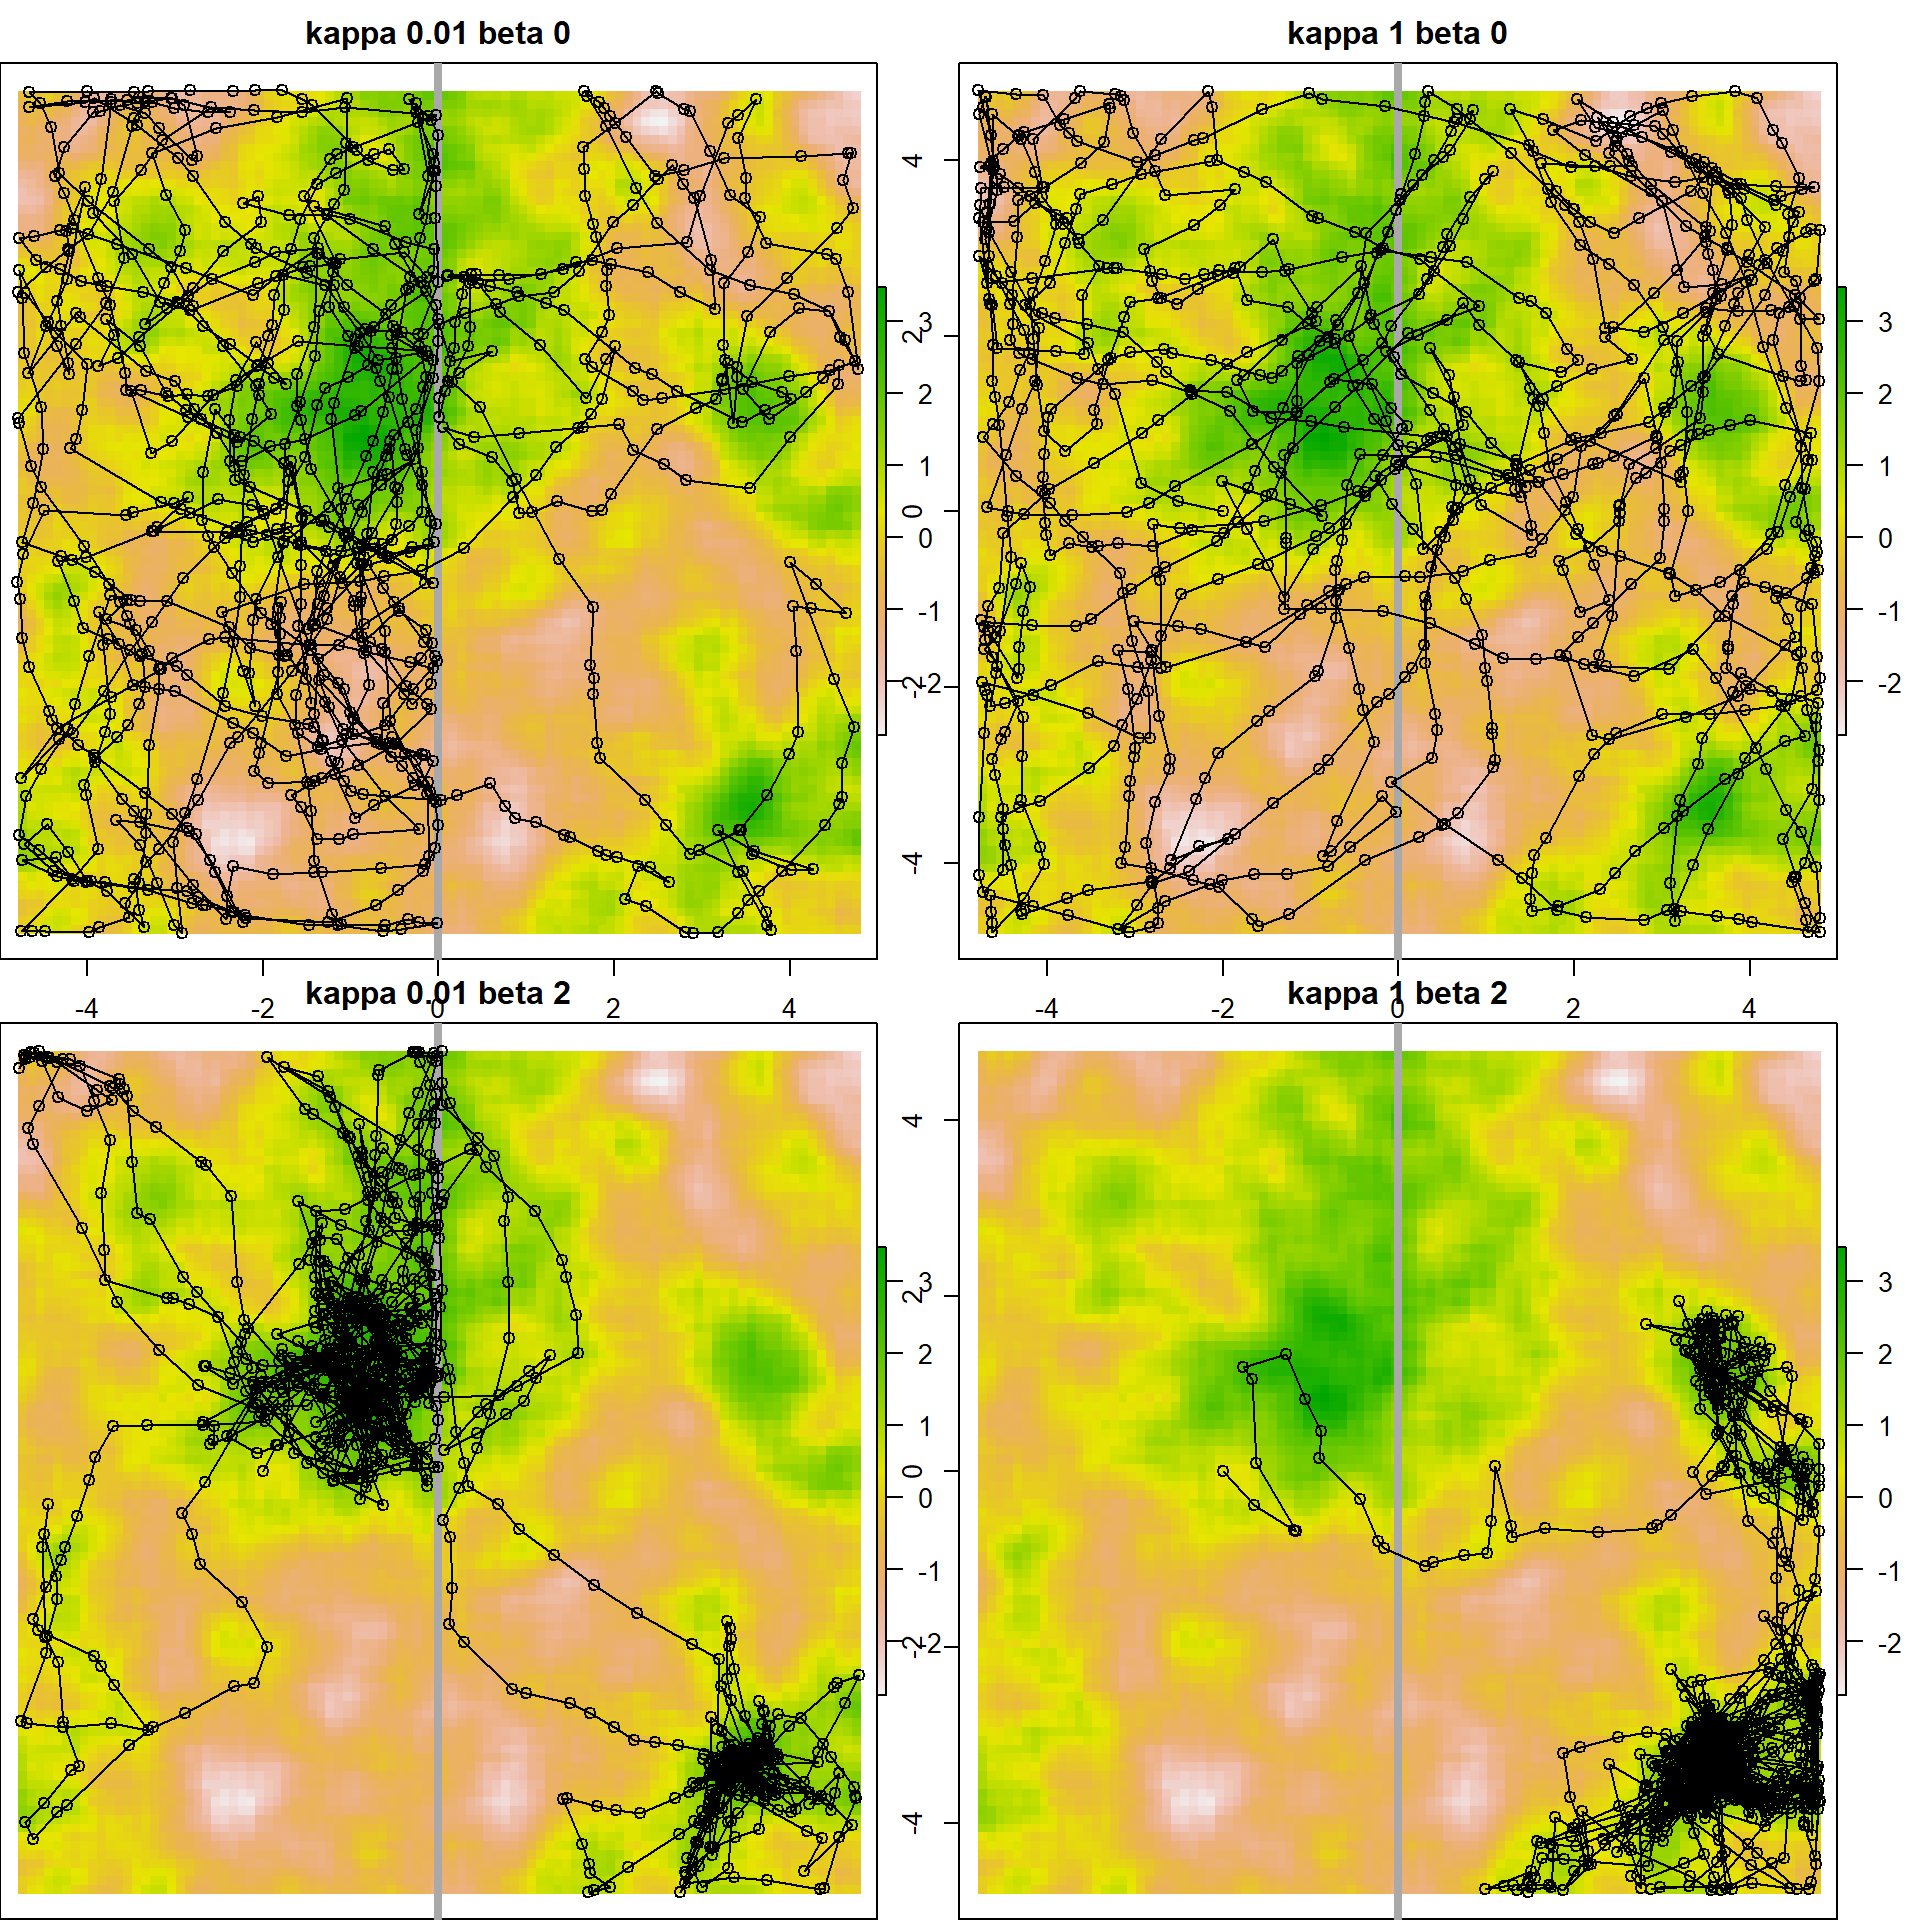] .pull-right[ - Simulated some tracks with barrier - Contrasted a range of **permeability** values (0 to 1) - Contrasted a range of **resource selection** values (0 to 2) ] --- # Estimates! .pull-left-70[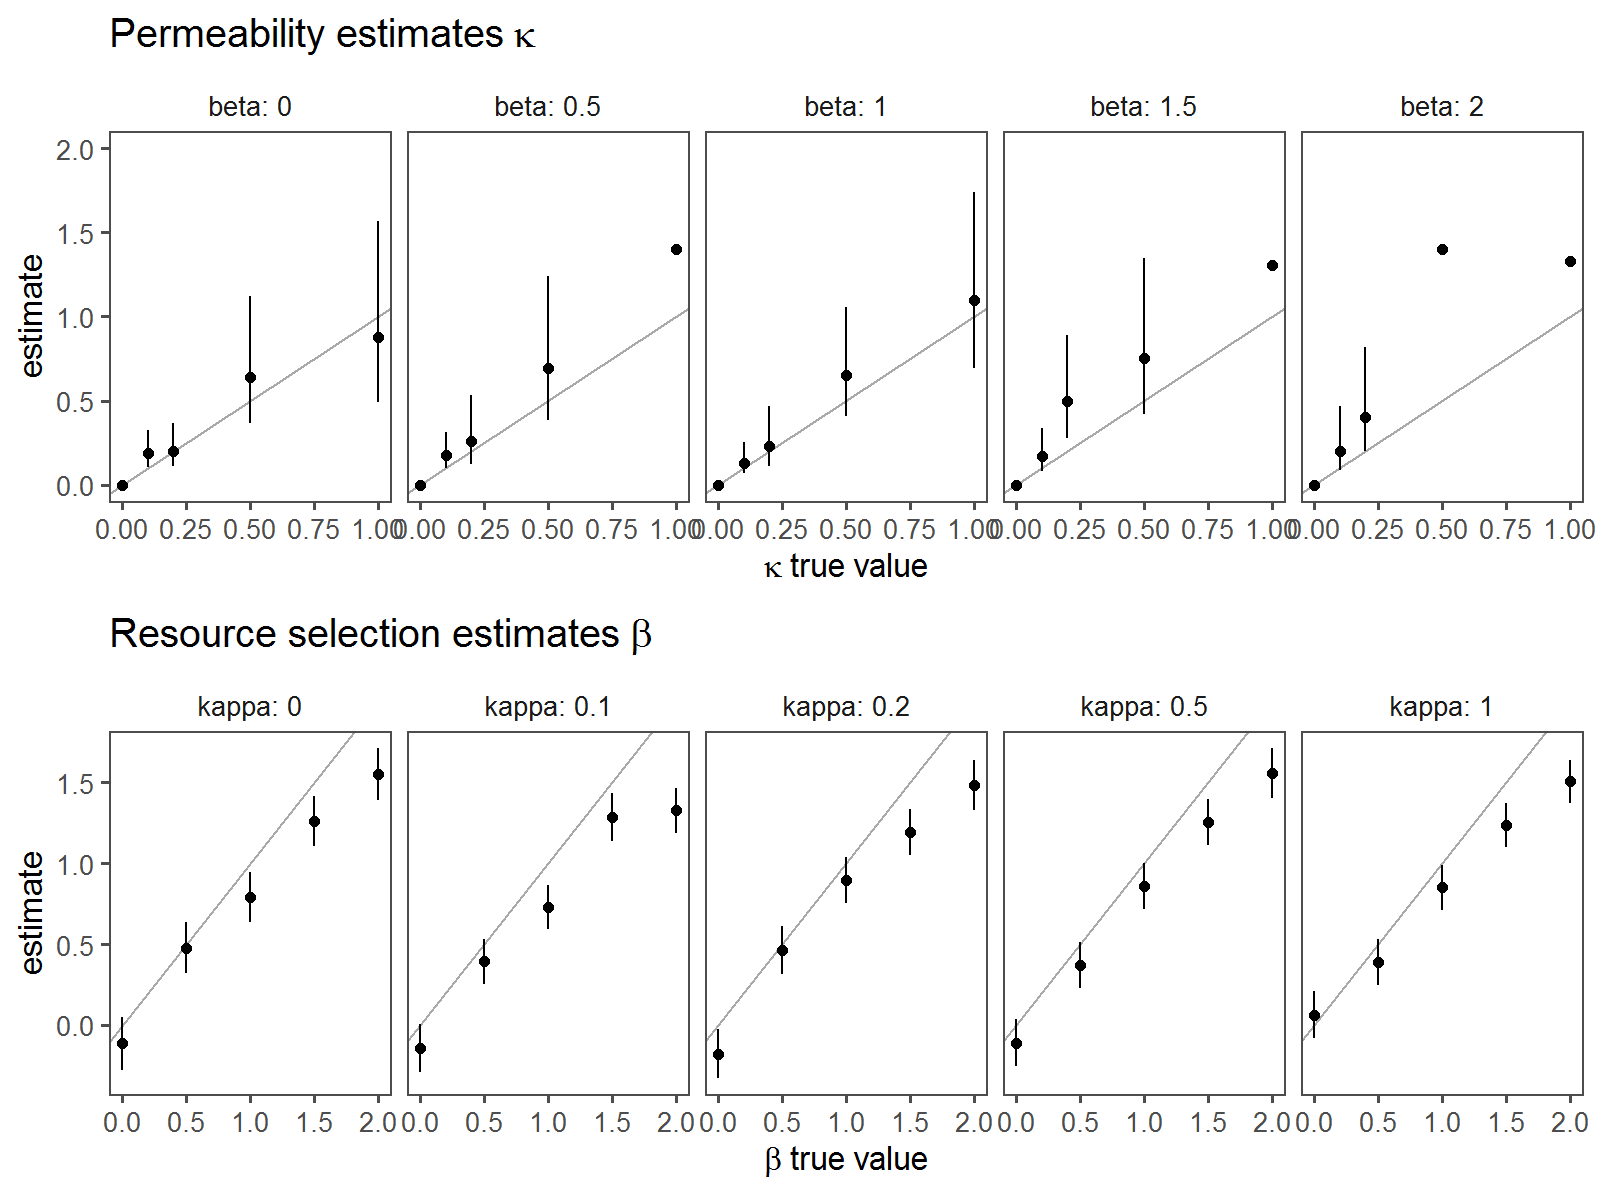] .pull-right-30[ .large[**Maximum likelihood estimates** work very well. ] ] --- # Example with Boreal Caribou 6 animals around HW1. **n** crossings out of **N** possible steps. .center[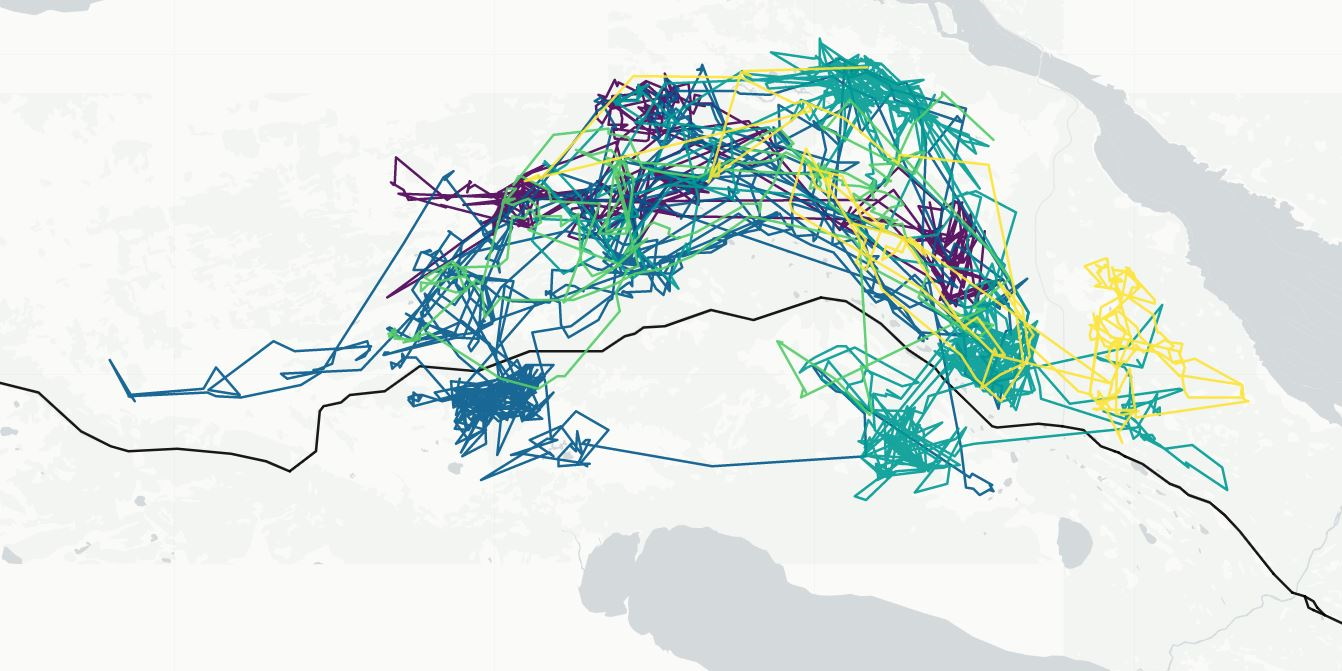] -- `$$\large \widehat{\kappa} = 0.24\,\, (95\%\,\text{C.I.}: 0.13-0.36)$$` **Interpretation:** caribou is 75% less likely to show up on the other side of HW1 than if the road weren't there. --- .pull-left-40[ # **Ekati-Diavik** results 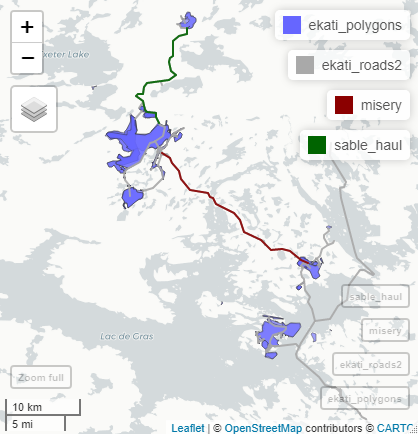 ] -- .pull-right-60[ 3-month average 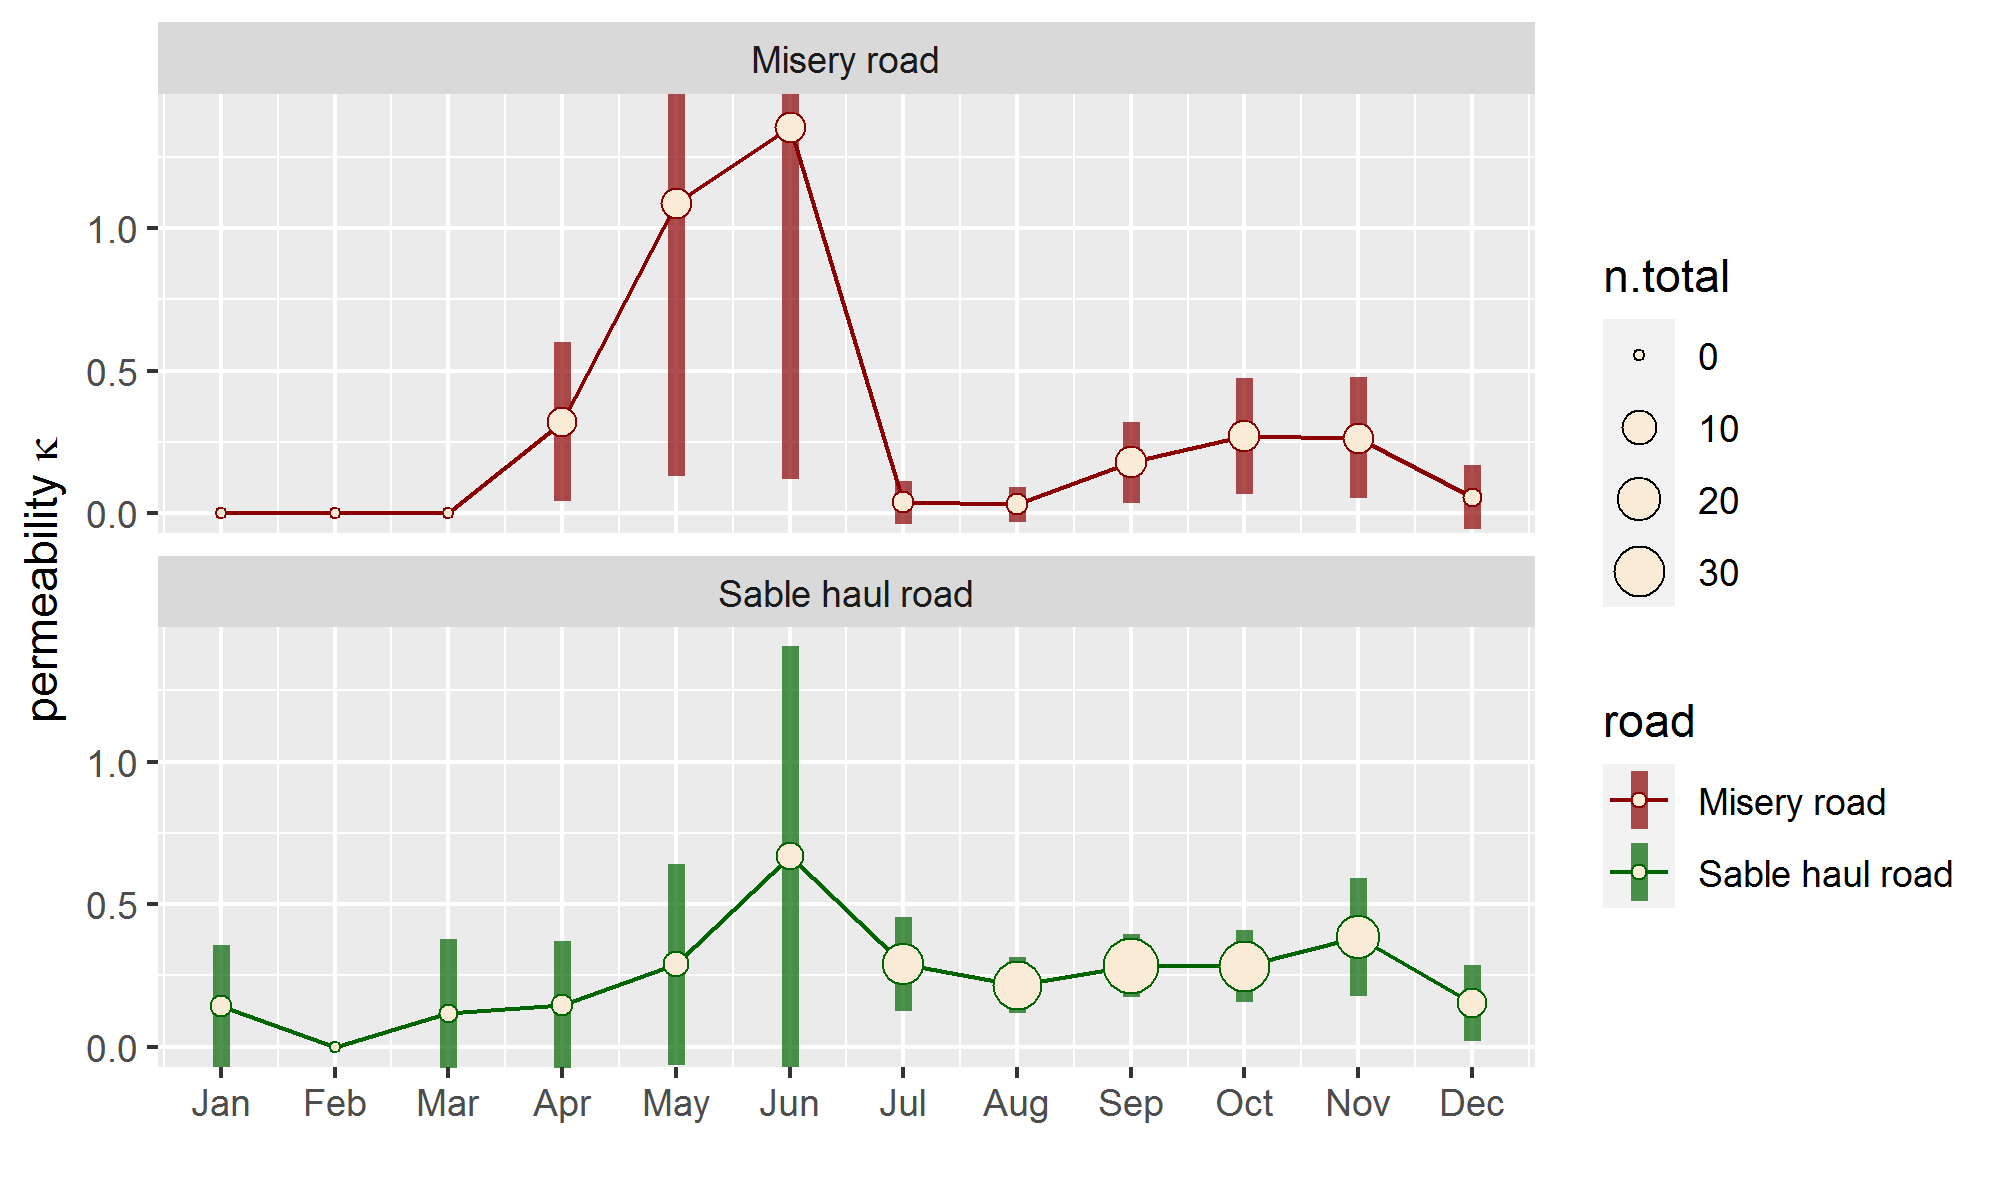 - .darkred[**Misery Road**] has permeability: - 0 Dec-Apr; `\(\approx\)` 0 Jul-Sep; slightly higher in fall - .green[**Sable Road**] generally higher **(0.1 - 0.3)**. ] --- .pull-left[ # Main take-aways .large[ **Permeability** & **Habitat Use** measure unique but important properties with (likely) important fitness consequences. Important for assessing: - Mitigation for artificial barriers - Climate-change impacts on natural barriers - Potential impacts of new barriers ]] -- .pull-right[ # (Near)-Future work .large[ - Develop & improve tools. - Assess sensitivity to sampling intervals - Improve speed - Build usable **R package** - Apply widely ]] --- # The hope ... .large[ - Designed to be **simple** and **general** and **straightforward to interpret** and **communicate** - (.blue[**bunch of movement data**] + .red[**bunch of linear elements**]) x .green[**analysis**] `\(\to\)` .purple[**permeability scores**]. - Very, very, widely applicable - at large scale - Perhaps integratable into **GIUM Atlas**? (or other related interface tools) ] --- background-image: url("images/merci.png") background-size: cover